The list of inevitabilities in the life of a data analyst or engineer includes death, taxes, unreasonable ad hoc requests from business stakeholders, and slow dashboards.
As you have countless times sat waiting for the loading wheel in Looker, Power BI, Tableau, or Google Analytics to stop spinning, you may have wondered…
- “Why is this dashboard so slow?”
- “Can I make it faster?”
- “How hard would it be to build a real-time dashboard?”
- “Are real-time dashboards worth it?”
I’m here to tell you that, yes, real-time dashboards are worth it. Not only are they exceptionally useful for operational decision-making, real-time data analysis, and tracking key performance indicators (KPIs), but they’re also becoming the de facto standard for data visualization, driven by a growing trend in data engineering and data-driven software development towards providing users - both internal and external - with better user experiences powered by real-time data analytics.
Are dashboards outdated?
Despite what some might say, no. Dashboards are not “dead,” nor are they outdated or obsolete.

There’s a common misconception that dashboards aren’t necessary; we should skip the visuals and go straight to AI-powered analytics and machine learning models for automated decision-making, predictive forecasting, real-time automation, and the litany of promises that AI adherents would have us believe.
But this is a false premise, driven by those who have lost faith in dashboards that are chock full of terrible, unreliable, low-quality data.
Those who think AI is the antidote to their data-driven ailments are wrong. In reality, just like machine learning models, dashboards are becoming more and more useful as data teams in data-driven organizations continue to improve the quality, consistency, veracity, and performance of data pipelines. As data gets better, dashboards get better.
People distrust dashboards because of low-quality data. AI won't fix that.
So, no, dashboards aren’t outdated. They’re better than ever.
But why are many dashboards so slow?
Dashboards are slow because the data pipelines underpinning them are slow. In many cases, this is due to poor data design: bad queries, improper indexing, expensive aggregates saved for query time, inefficient caching, etc.
But even if your tables and SQL are in tip-top shape, your dashboards still might be a bit sluggish.
Dashboards are slow because of bad data models and tools that aren't meant for real-time.
To understand why, you can flip through the pages of enterprise data history books. From the Big Data movement to the Modern Data Stack, most data infrastructure and data tools were created to support a singular function: strategic decision-making by C-level executives.
The time horizon for boardroom decisions is far-reaching: often quarters or years. Because of this, business intelligence dashboards don’t need to be fast. It’s perfectly fine to run a report overnight and fire off a PDF to the CEO’s inbox at 7 AM the next morning.
Cloud data warehouses, business intelligence reporting tools, and the data engineers who wield them take advantage of this. They make conscious choices to trade speed for user-friendly interfaces and the ability to process large amounts of data on distributed storage and compute. These technologies weren’t built for real-time operational intelligence, automation, or interactive user experiences. The ETL/ELT pipelines that data engineers build to create business metrics and feed these tools often run infrequently, resulting in potentially out-of-date information.
But with the rise of real-time data and streaming architectures, we have an opportunity to build faster dashboards based on the freshest data. These are what we call “real-time dashboards”, and they are definitely worth it.
What is a real-time dashboard?
A real-time dashboard displays metrics or KPIs built from data that is seconds old (or fresher) as well as historical data, returns a response to new queries in only milliseconds, and can support thousands of concurrent requests without lagging.
What is the objective of a real-time dashboard?
Real-time dashboards serve two primary functions: operational intelligence and enhanced customer experiences. They enable high-speed data visualization that allows internal stakeholders and external customers to act upon the freshest data available.
Real-time dashboards can be used for internally-facing operational intelligence or externally-facing customer experiences.
Real-time dashboards for operational intelligence
Whereas business intelligence is used to make decisions on time horizons spanning quarters or years, operational intelligence is used to make day-to-day, hour-to-hour, and minute-to-minute decisions within a business.
Analysts, operations managers, and engineers can use live dashboards displaying critical KPIs to make snap decisions about how to operate the business effectively and in the moment.
Some examples:
- Sales and marketing teams at large retail companies monitor the performance of sales in real-time, optimizing advertising campaigns to drive higher conversion rates.
- Logistics managers use live dashboards to track inventory in real-time, making decisions to divert inventory where demand is higher.
- Airline technicians use real-time dashboards to track customer luggage from terminal to terminal, reducing the number of bags that get lost or misplaced.
- IT managers use real-time dashboards to identify DDoS attacks, server downtime, or performance degradations across a company’s IT infrastructure.
Real-time dashboards for enhanced customer experiences
In the old days, a company’s data was mostly used for internal decision-making. Now, that data is being injected back into the product. Real-time analytics is powering differentiating user experiences, using dashboards and real-time data sources to help customers make better use of the product, increasing customer satisfaction.
Some examples:
- A bank or investment company shows its customers how their investments are performing in real time compared to historical trends.
- A MarTech SaaS serves customers with real-time analytics on search data so that marketers can optimize SEO campaigns.
- A social media platform gives content creators real-time insight into media engagement and performance.
- A sports betting company shows live bet spreads on their media channels.

What are the benefits of real-time dashboards?
Broadly speaking, dashboards are valuable because they allow humans to make informed decisions.
An article from Harvard Business School outlines a few examples from Google, Starbucks, and Amazon. These enterprises use data visualizations to improve favorability scores for managers, pinpoint ideal store locations, and increase customer conversion rates, respectively.
What makes real-time dashboards so special is their ability to massively shorten the time to a decision and the subsequent feedback loop. In terms of business performance, this has obvious operational implications. Those with fresher, faster data can make faster decisions, generate feedback on those decisions more quickly, and iterate new solutions faster than the competition. Speed is a serious competitive advantage, and real-time dashboards increase decision-making speed.
But the benefits of real-time dashboards extend beyond business decisions and into the realm of customer experiences and product differentiation.
As I described above, real-time dashboards aren’t just used for internal stakeholders, but also for external customers. You can embed real-time dashboards into user interfaces to give users information that helps them better use the product. Real-time dashboards make a meaningful difference in improving customer satisfaction, reducing churn, and increasing customer lifetime value.
When embedded into user experiences, real-time dashboards can become powerful, differentiating features.
Said differently, dashboards are no longer tools for dropping the bottom line, but also for increasing top-line revenue through differentiation and increased customer value.
How do I create a real-time dashboard?
Creating a real-time dashboard is easier than you think. You can follow this step-by-step tutorial and have a beautiful, responsive, and interactive real-time dashboard built in less than an hour.

The important thing when creating a real-time dashboard is to use tools fit for the purpose. If you’re trying to build real-time dashboards using Looker and BigQuery, PowerBI and Azure Synapse Analytics, or Tableau and Postgres, then you’re going to either struggle to make things real-time or end up paying a ton to do so.
You need to choose real-time data infrastructure that’s designed to support real-time dashboards.
What tools should I use to build real-time dashboards?
The tools for real-time dashboards can be broken down into four basic categories:
- Real-time data collection. Use real-time data architectures and streaming platforms for real-time data ingestion to collect and process the freshest data sets.
Streaming platforms like Apache Kafka, Confluent, Redpanda, and Amazon Kinesis or message queues like Google Pub/Sub or RabbitMQ allow you to capture data using event-driven architectures, ensuring you have the freshest data available for visualization. - Real-time data processing. Real-time dashboards require real-time data processing engines. You need to be able to filter, join, aggregate, and otherwise transform data streams as they arrive to build useful KPIs and performance metrics for your dashboards.
For real-time processing, you can use real-time databases (like ClickHouse, Apache Druid, and Apache Pinot), stream processing engines (like Apache Flink), or analytics engines (like Apache Spark), each with varying degrees of complexity.
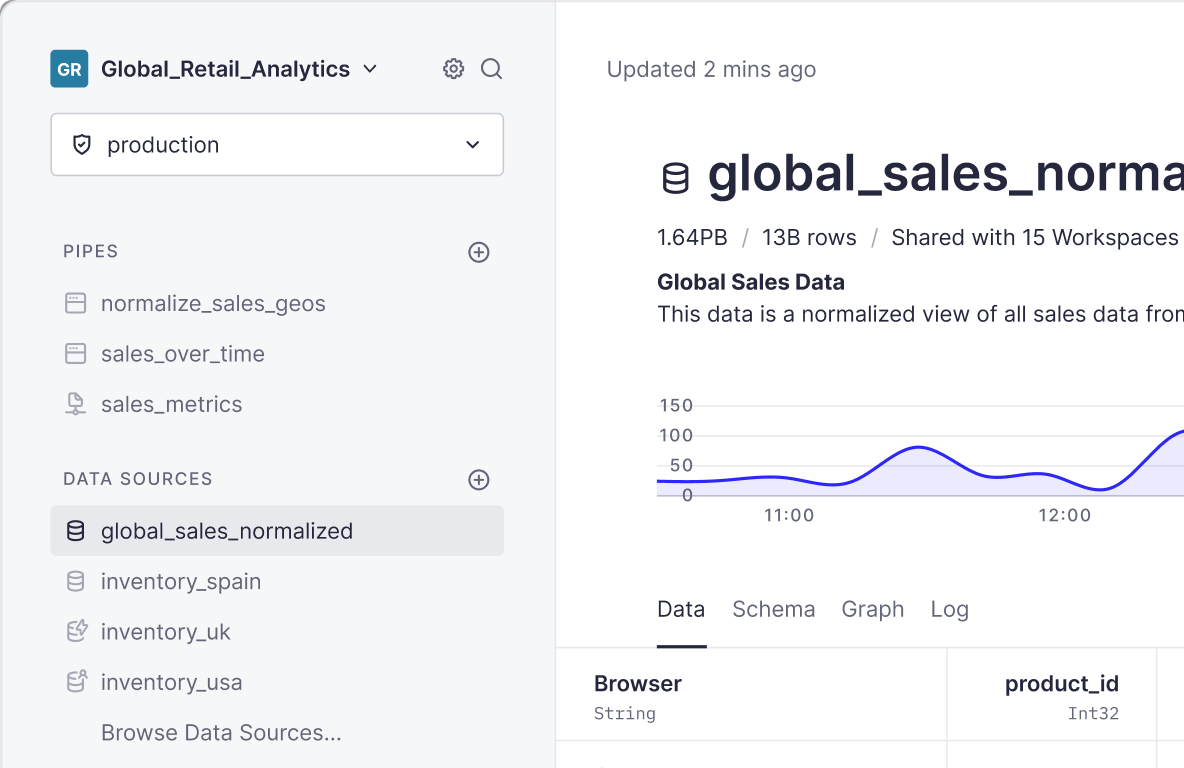
To avoid complexity, you can turn to a real-time data platform like Tinybird, which provides end-to-end real-time processing capabilities through native streaming data connectors and an intuitive SQL interface to build and publish analytics metrics for your dashboards. - Real-time data storage. Real-time dashboards visualize data stored in a database. That can be anything from a cloud data warehouse like BigQuery or Snowflake to in-memory key-value stores like Redis.
There’s also a middle ground of real-time databases that provide the flexibility of a full online analytical processing (OLAP) engine but at speeds closer to in-memory stores. Examples here include those mentioned above (ClickHouse, Druid, and Pinot). - Real-time visualization tools. Depending on your use case, classic business intelligence tools like Looker, Power BI, and Tableau might not work. For example, if you want to embed your real-time dashboard directly into a web application, you’ll be better off using a modern JavaScript framework like React or Next.js to build visualizations in the product.
For some, more modern BI tools like Domo or Apache Superset can alleviate some of the pains of traditional BI tools.
Getting started with real-time dashboards
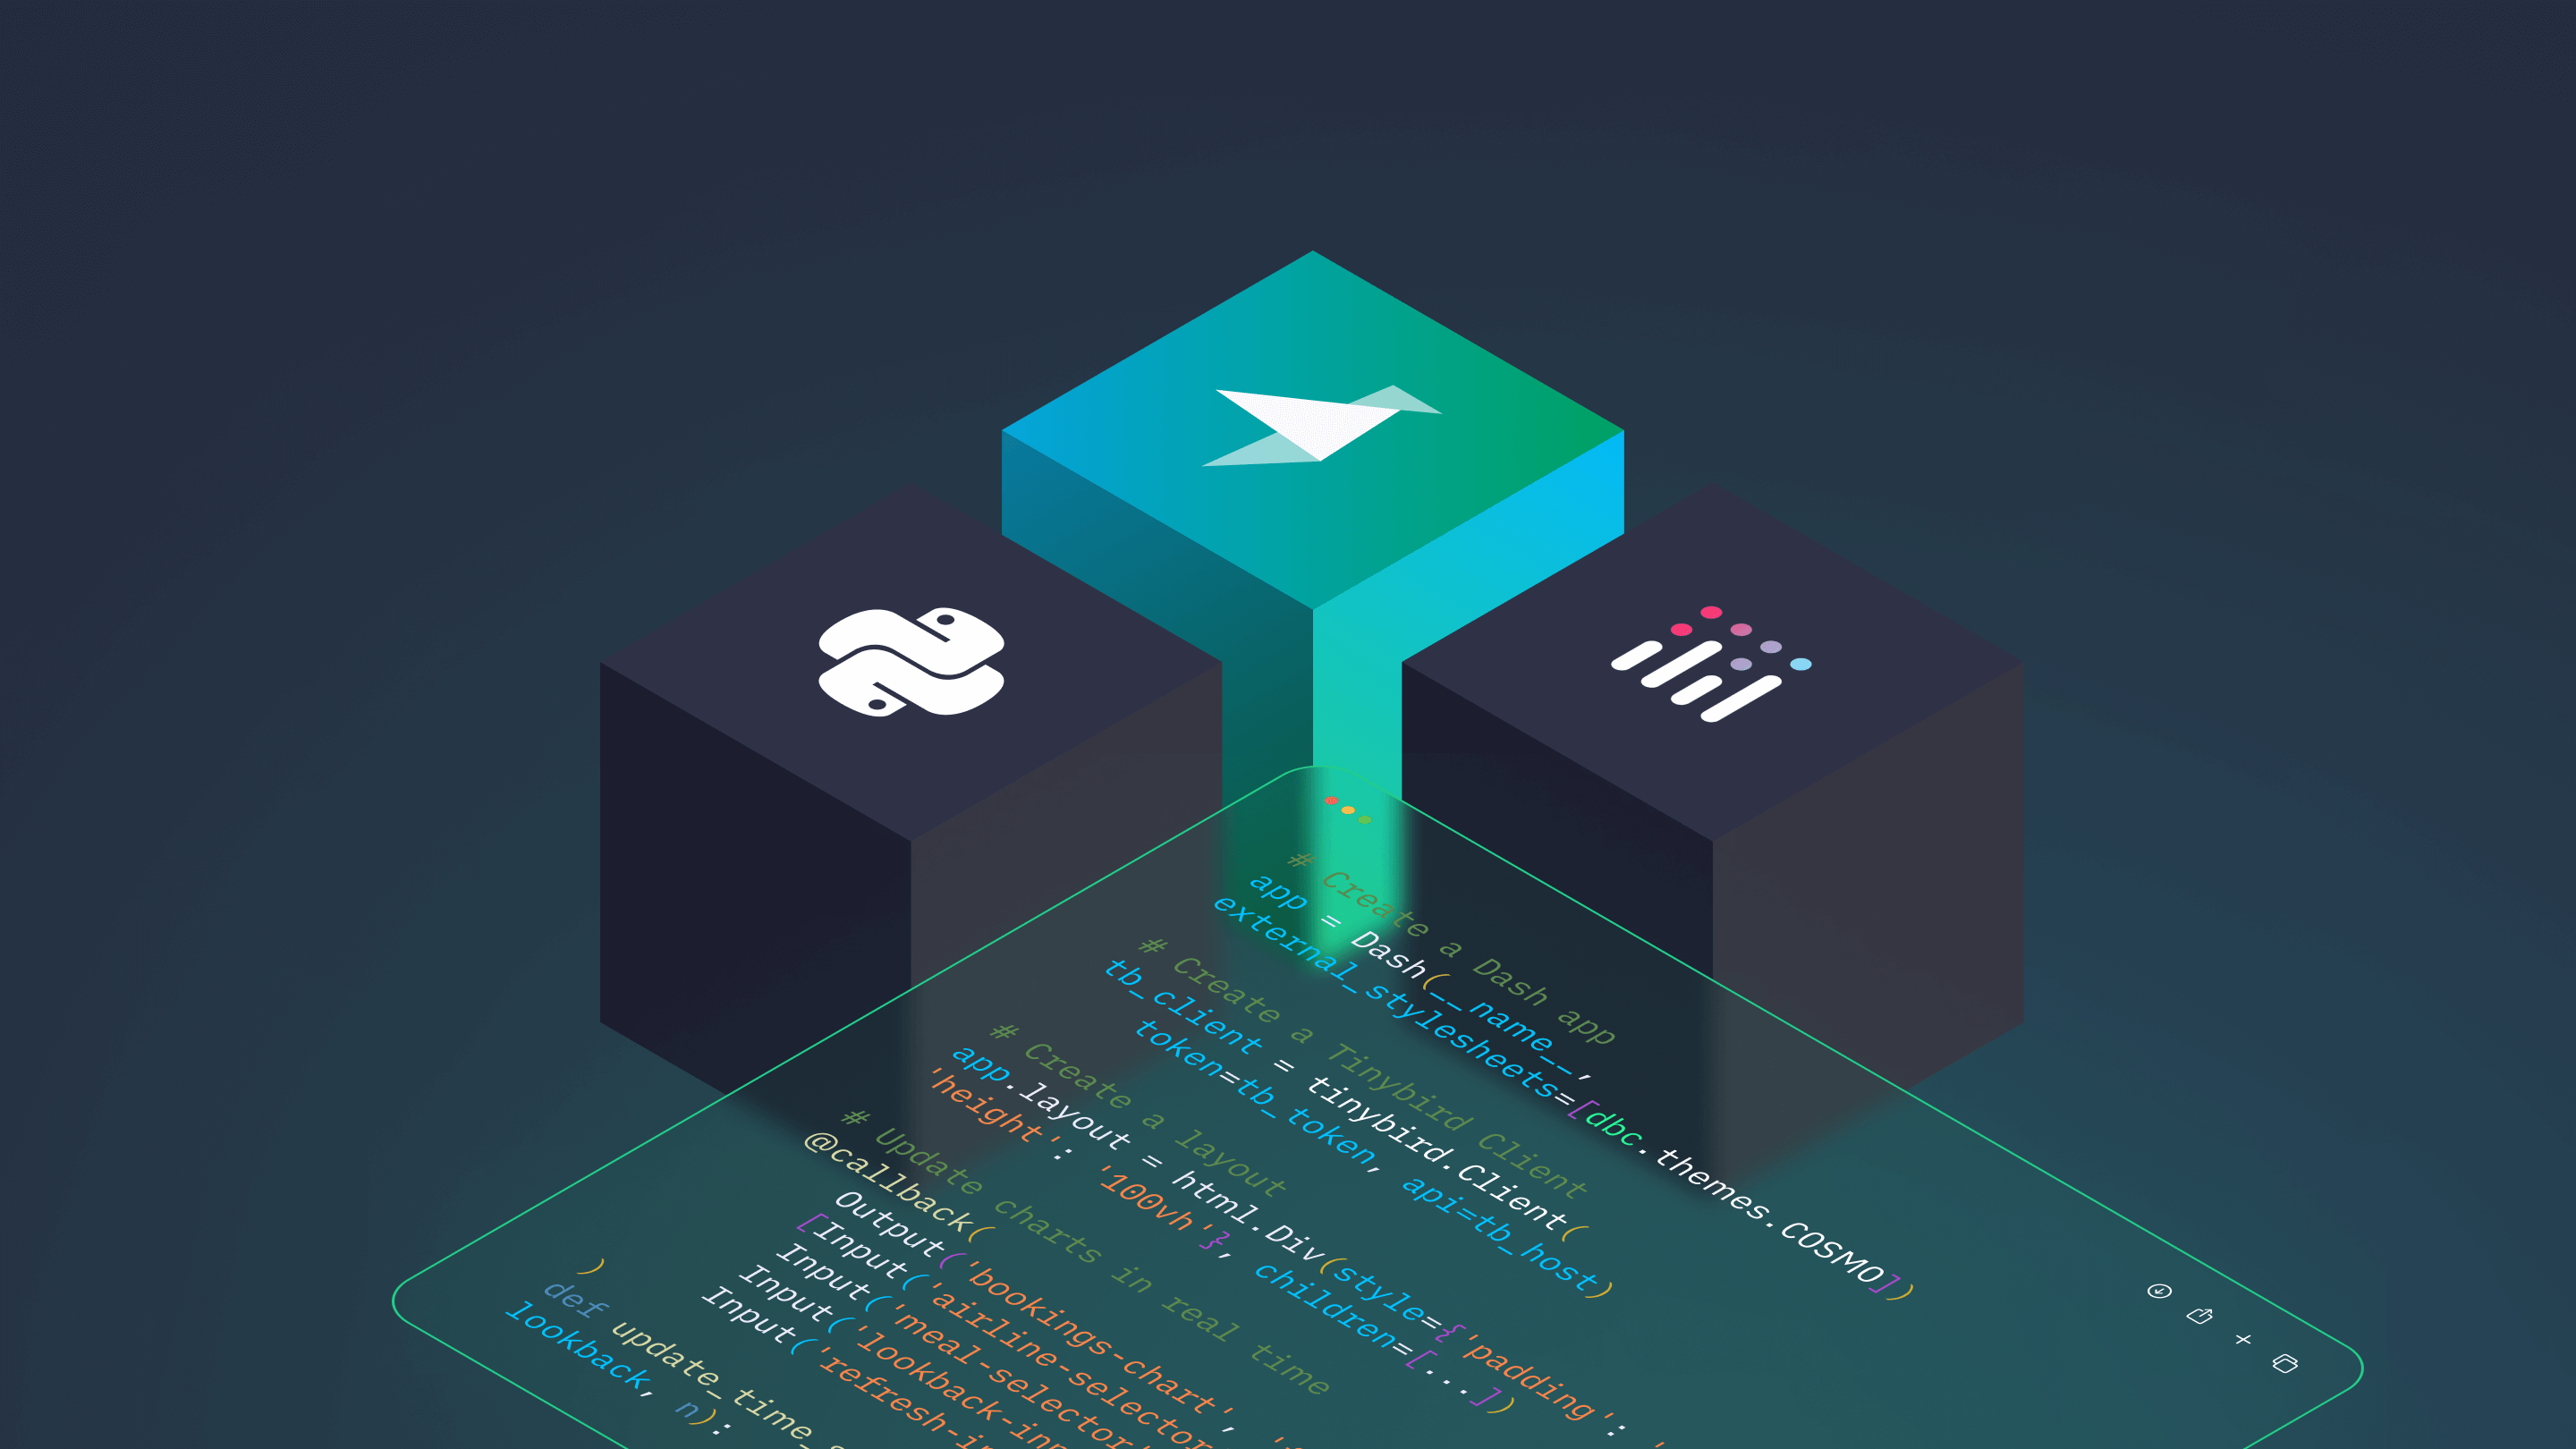
If you’re ready to make the switch to real-time dashboards, I highly encourage you to take a look at this tutorial. You can build a real-time dashboard using Tinybird, Next.js, and Tremor - a dashboard chart components library for React - in less than an hour. All of these tools are free to get started.
If you’d like to better understand how to build a real-time data pipeline to support your data visualizations, then I’d encourage you to request a demo of Tinybird. Tinybird is a real-time data platform that makes it very easy to capture streaming data at scale, build metrics and KPIs with nothing but SQL, and publish your metrics as real-time, low-latency APIs to power your real-time analytics dashboards.
Tinybird a real-time data platform that makes it simple to build real-time data pipelines and expose them as APIs for building real-time dashboards.
If you’re ready to start building with Tinybird, you can sign up for free here.