What does it take to build a fast dashboard? Dashboard loading time is a core frustration for many analysts, engineers, and end users. Slow dashboards make for a terrible user experience. Whether your users are internal stakeholders or external customers, you want to avoid dashboard performance issues that slow your end users down.
What makes a dashboard slow?
The core causes of slow dashboards can be boiled down to seven common themes:
- Poorly constructed SQL queries
- Using the wrong database
- Failing to pre-filter and pre-aggregate data views
- Failing to cache query results
- Slow network performance
- Using scheduled ETLs instead of event-driven architecture
- Using batch processing instead of real-time processing
Fortunately, many of these are relatively easy to fix. Whether you're trying to build a real-time dashboard for a modern web application, speed up data visualizations built over a data warehouse, or resolve Tableau dashboard performance issues, these tips can help you speed things up.
How to improve dashboard performance
Here are seven ways you can make your dashboards faster:
- Optimize your SQL queries
- Move raw data to a real-time database
- Create pre-filtered and pre-aggregated views
- Cache query responses
- Host your data closer to your users
- Use event-driven architectures
- Utilize real-time processing engines
Tip #1: Optimize your SQL queries
Bad queries are the top cause of slow dashboards. Simply optimizing reads to process less data can increase dashboard performance by orders of magnitude.
Unoptimized SQL queries are common, but fortunately, they are relatively easy to fix. To make your SQL queries faster, follow these five generalized rules:
- Filter first. Filtering first can massively reduce the amount of data your queries must read, especially if you filter by indexed columns.
- Join second. Performing joins before filtering adds unnecessary load
- Aggregate last. Aggregating is an expensive SQL operation. Save it for last after you've completed all necessary pre-processing.
- Pre-filter your joins. If possible, use subqueries on the right side of your joins to minimize the amount of memory required to perform a join. The smaller the tables you're joining, the faster your joins will be.
- Only select the columns you actually need. This may seem obvious, but
SELECT *is generally a no-no. Be specific about your columns to minimize processed data.
In addition, pay attention to indexes and sorting keys, and use indexing strategies that will reduce the amount of data your queries must scan.
The more complex calculations you make, the more important it is to get your SQL right. You can read more about the 5 rules for writing faster SQL queries.
Here's an example of these rules in action. Below is a query designed to get total product sales for “shoes” in the last 7 days. The query, however, is horribly inefficient:
It breaks almost all of the rules, resulting in expensive operations that slow things down. Applying the rules results in a faster, more performant query:
Tip #2: Move raw data to a real-time database
Fast dashboards require data storage technologies that are optimized for...
- analytical queries, and
- real-time data ingestion
Transactional databases like Postgres are very fast at reading single rows, but not fast at aggregating over columns without lots of time-consuming database tuning.
Data warehouses are powerful for data analytics like aggregating and filtering over columns, but they are not fast at returning query responses in real time or for handling lots of concurrent queries.
In-memory key-value stores like Redis can help you speed things up, but they don't allow you to write custom SQL or aggregate lots of different data sources.
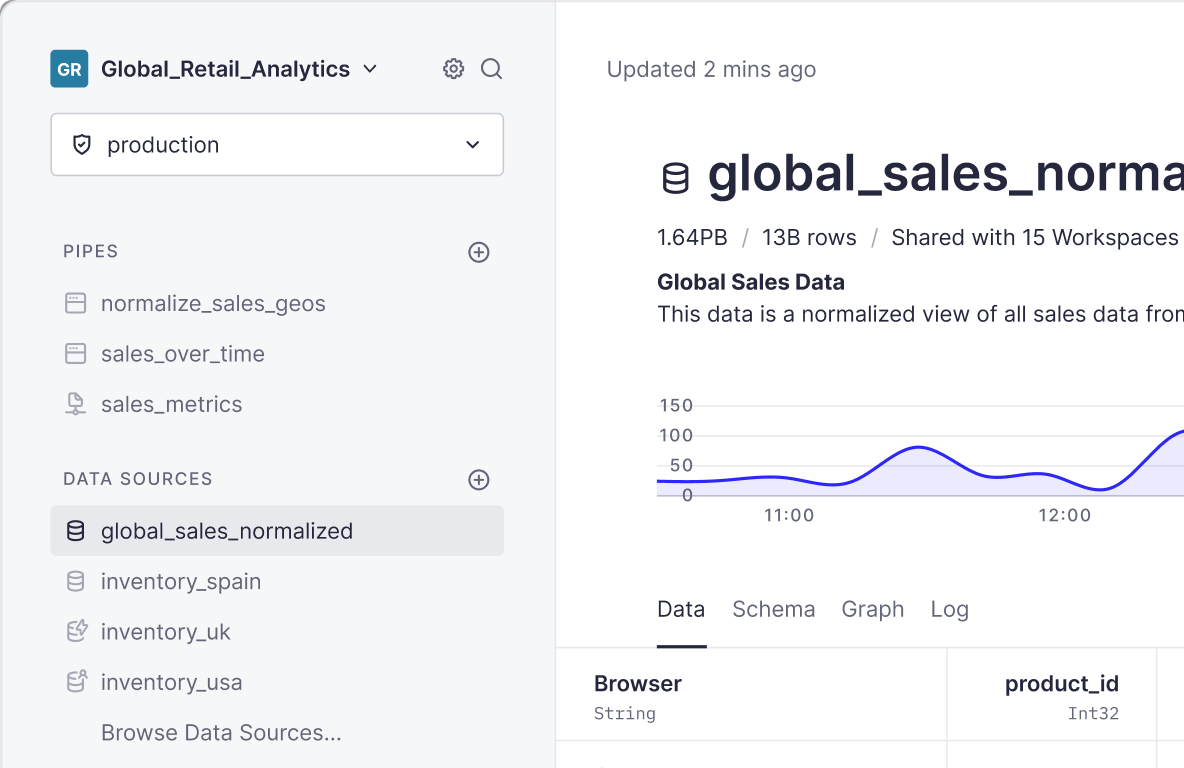
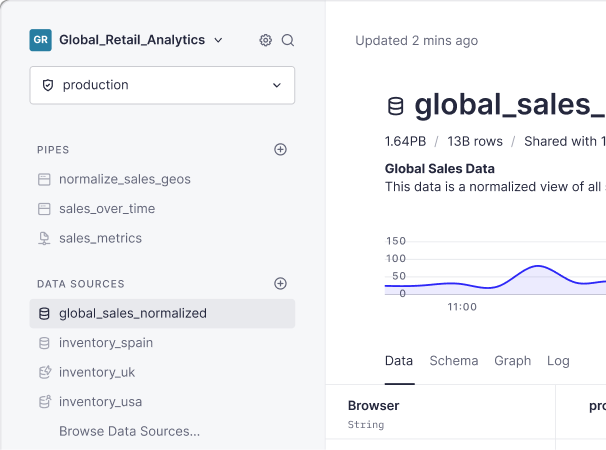
If you can't use a cache and you need a fast underlying data layer, copy or move your data to a real-time database like ClickHouse or a real-time data platform like Tinybird.
Tip #3: Create pre-filtered and pre-aggregated views
It's often inefficient to query a raw data table, as these tables often contain way more rows and columns than you need for a single dashboard. Consider creating dedicated tables or views to support your dashboards that only contain the data your dashboard actually needs. This will limit the amount of data your dashboard requests must read and move the computation of calculated fields to write time instead of read time.
For example, in Tinybird (a real-time data platform that supports real-time data visualizations), you can create real-time Materialized Views that pre-filter and pre-aggregate results at data ingestion time. These results are stored on disk and can be queried much more quickly than if you filtered and aggregated over the raw table at query time.
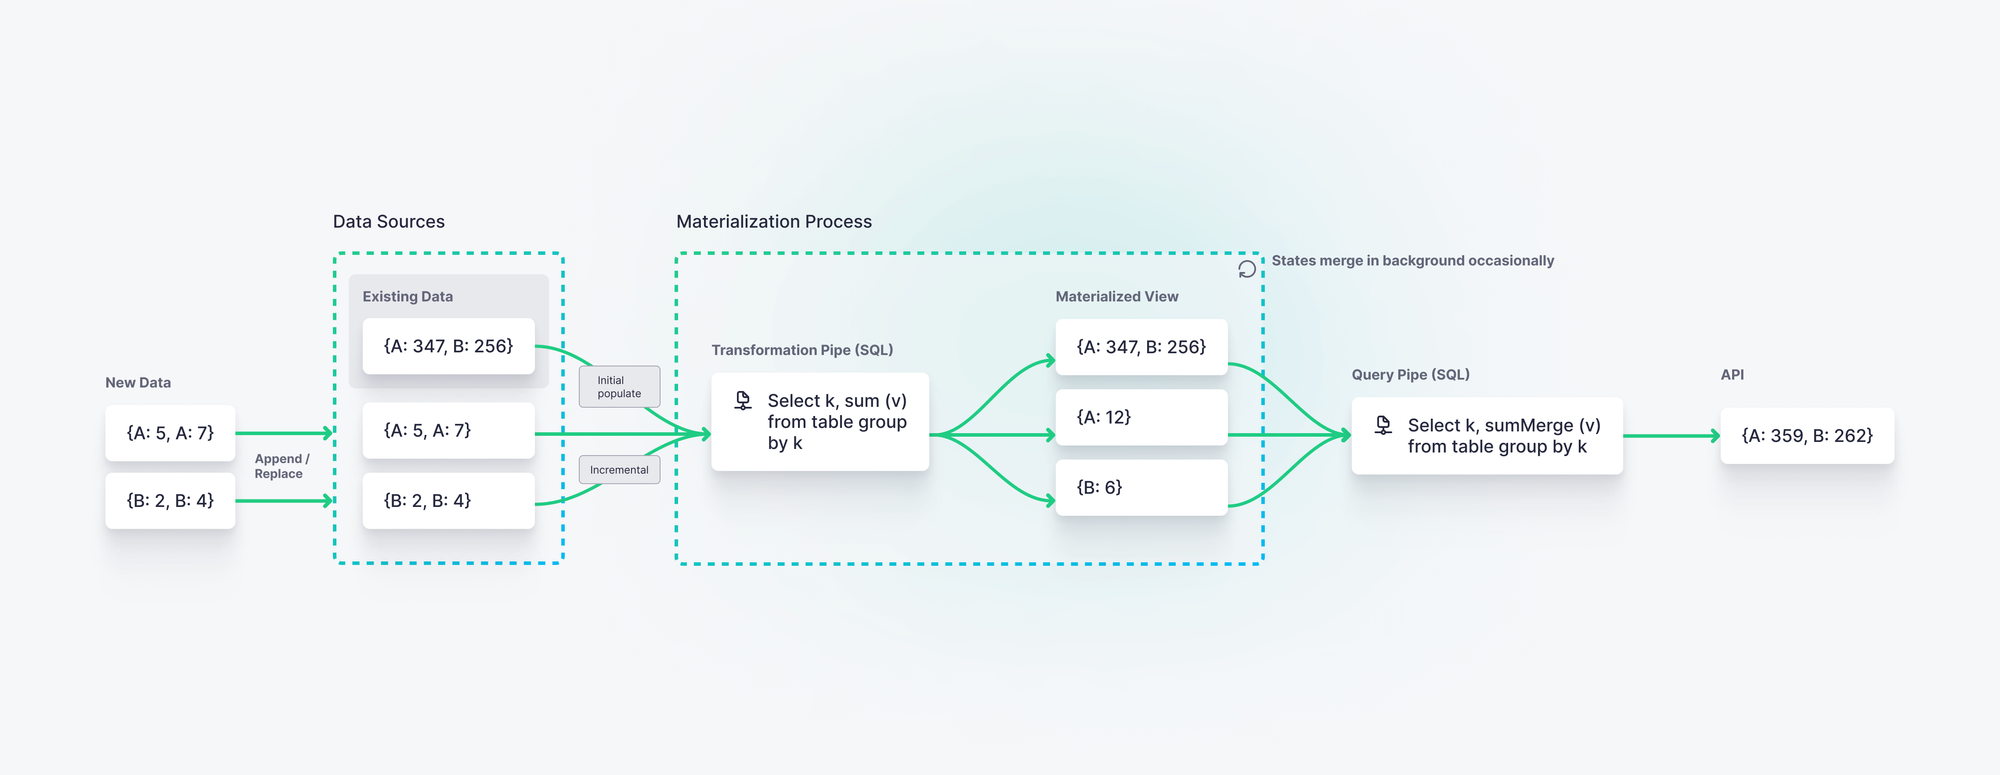
One example of this is using rollups to limit time series granularity. By pre-calculating aggregates by time groupings, you can query those aggregates directly rather than aggregate them at query time.
Tip #4: Cache query responses
In cases where your source data set changes relatively infrequently, utilize a cache to store query responses in memory. If you don't need to read data from disk to populate your dashboard, things will go much faster.
Caching isn't always the right choice, however. If you want to build a real-time dashboard over streaming data sources, cached results may become outdated too quickly.
Use this rule of thumb to determine if caching is a good idea:
Tip #5: Host data closer to your users
If you're trying to eke out every last ounce of performance, don't forget about network latency. The closer your data is to the user request, the faster your dashboards will load. If your users are in Europe, host your data in Europe. If they're in the US, host it in the US. You can get even more fine-grained by replicating data across many regional data centers as well.
Tip #6: Use event-driven architectural principles
Sometimes making your dashboard faster doesn't just mean reducing query latency, but also improving the freshness of your data. Consider a user-facing dashboard displaying information about a delivery food order. That dashboard is no good if the location data of your order is 30 minutes old. You need data that is just seconds old.
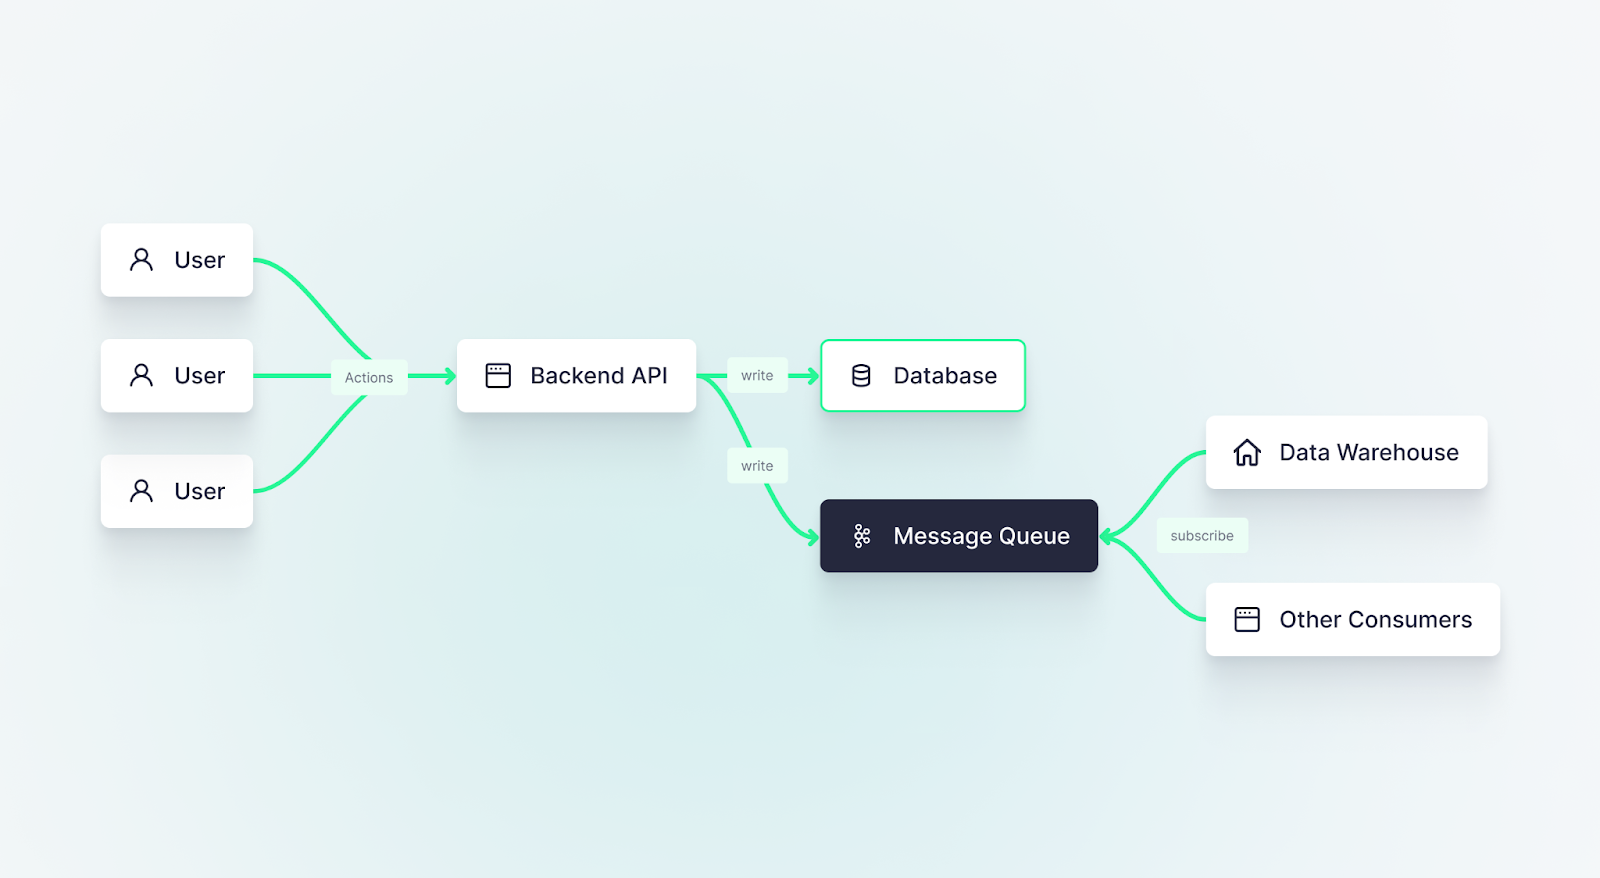
If you want to display fresh data in your dashboard, you need to dispense with batch data ingestion and shift to an event-driven architecture that utilizes streaming platforms or message queues for event propagation. Read more about event-driven architecture best practices.
Tip #7: Utilize real-time processing engines
The more you process and transform your data in real time (when the data is created), the less work your dashboard will need to do at query time. If you want to use streaming data sets for your dashboard, you'll need to use real-time data processing engines to filter, aggregate, and enrich that data in real time.
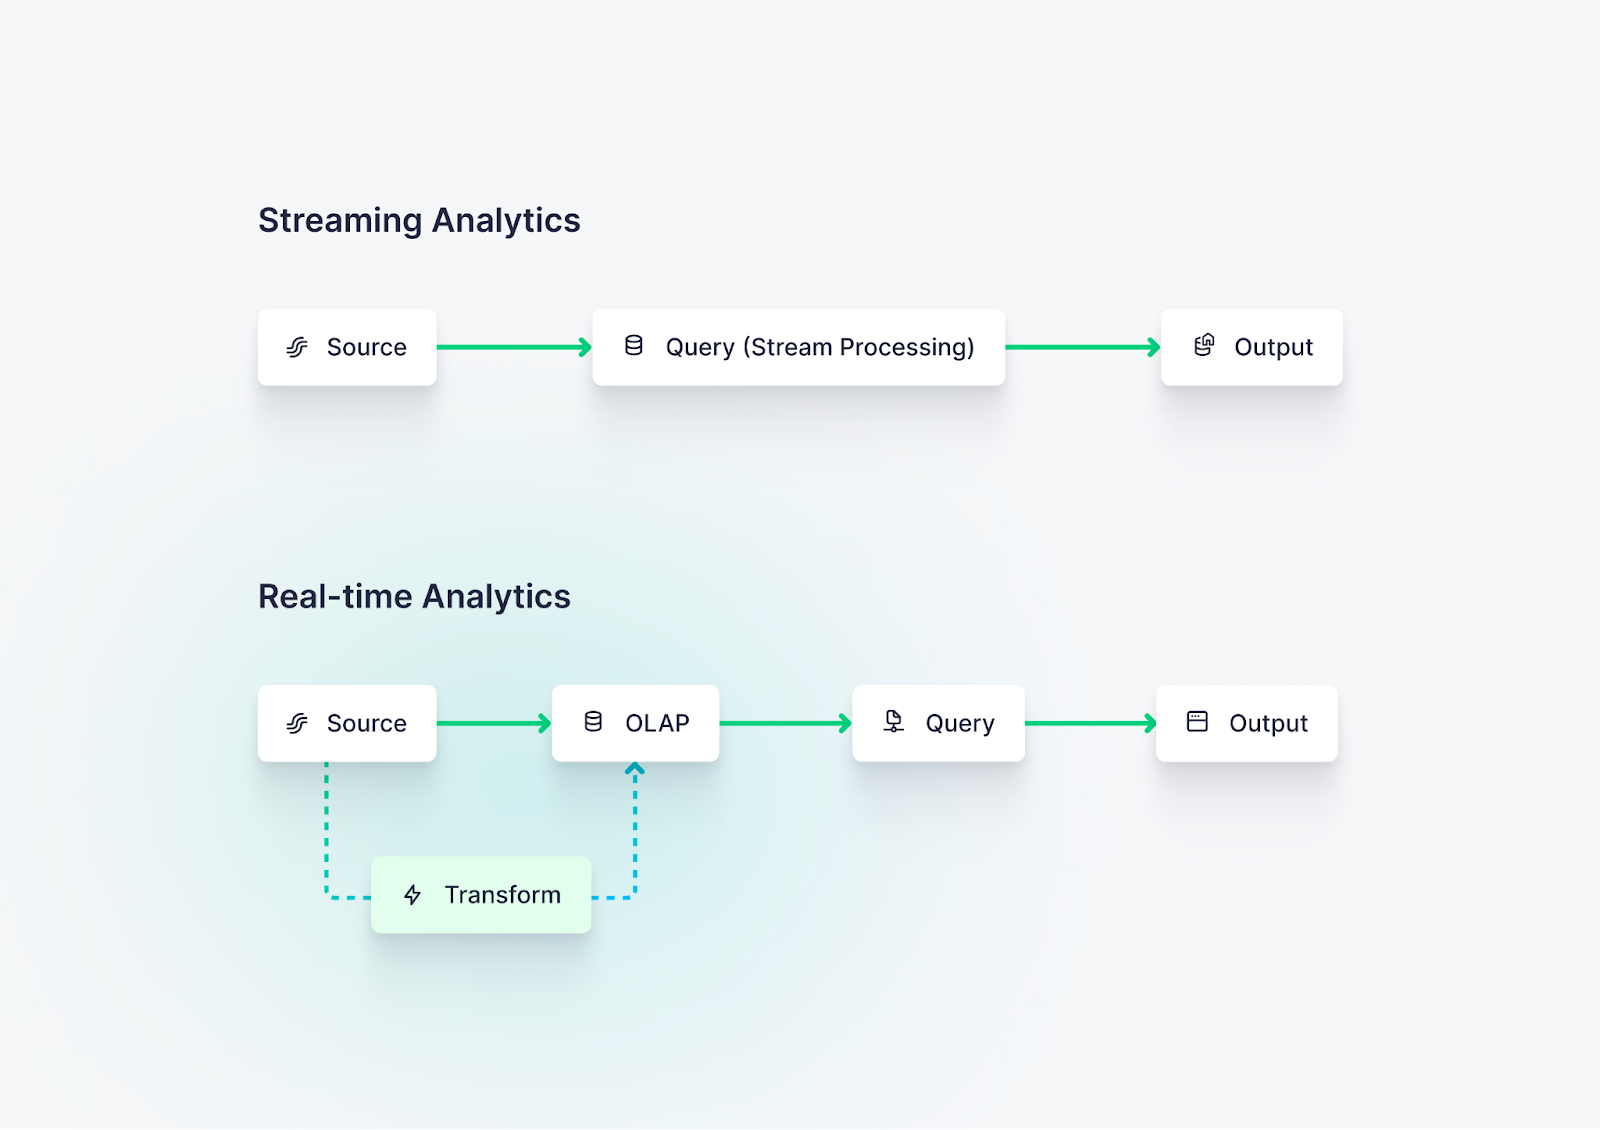
You can use a stream processing engine or a real-time database to process data in real-time, rather than waiting for data model calculations on infrequent cron schedules in your data warehouse. You can learn more about real-time data processing here.
Get started making your dashboards faster
If you follow these seven tips, you'll be able to improve the performance of your dashboards, reduce query latency, and enhance data freshness.
If you're looking for better tools to build real-time dashboards, consider a real-time platform like Tinybird. With Tinybird, you can capture streaming data, process it in real-time with SQL-based Pipes, store pre-aggregated data in real-time materialized views, and publish critical metrics as low-latency, scalable APIs.
To learn more about Tinybird, check out the documentation. If you're ready to start building, you can sign up for free here and follow this tutorial to build a real-time dashboard from scratch.

If you're interested in seeing how Tinybird can speed up your user-facing dashboards or internal operational analytics, book a demo with us and tell us more about your use case.