Sick of manually wrestling with Google Sheets like it's an Excel spreadsheet from 2005? Feel like force-quitting Chrome every time you attempt to sift through just 10,000 rows of data?
Let's level up. Tinybird makes it simple to query even the largest Google Sheets tables in real-time using SQL so you can build real-time analytics metrics and publish them as secure, interoperable APIs.
If you want to get your hands dirty and follow along with this tutorial, the GitHub repository awaits.
How to query your Google Sheets data in real-time
Follow these steps to query a Google Sheet with SQL.
Step 1: Sign Up for Tinybird
Tinybird is a real-time data platform that makes it easy to query any amount of data using SQL and publish your metrics as real-time APIs. You can use Tinybird as a backend for customized real-time dashboards or to integrate data-driven features into your website or product. You can find more information about Tinybird in its documentation.
Tinybird has a time-unlimited free tier, so you can start building today and learn at your own pace. Sign up for a free account here.
After you sign up and confirm your email, you can create a Workspace. Give your Workspace a name; you can call it whatever you want, but you’ll usually want to name it after what you are building, like google_sheets , or whatever you titled your spreadsheet.
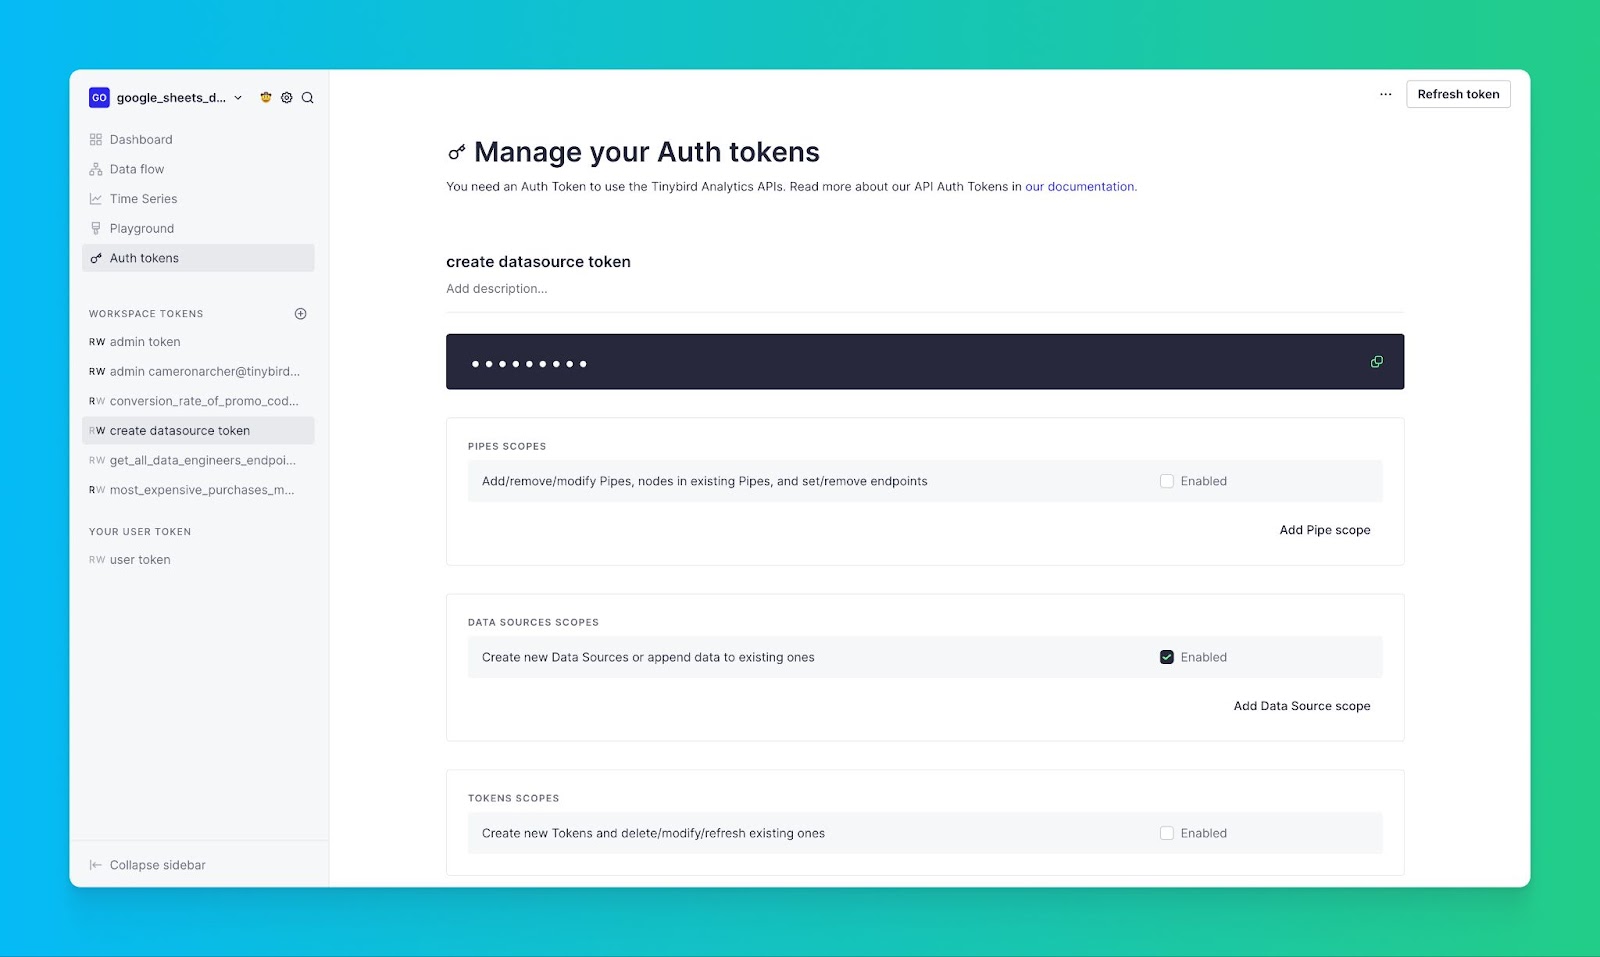
Step 2: Obtain Your Tinybird Auth Token
All Tinybird resources are protected by Auth Tokens. Navigate to your Tinybird dashboard in your Workspace, click “Auth Tokens” from the left navigation bar, and copy the “create datasource” token.
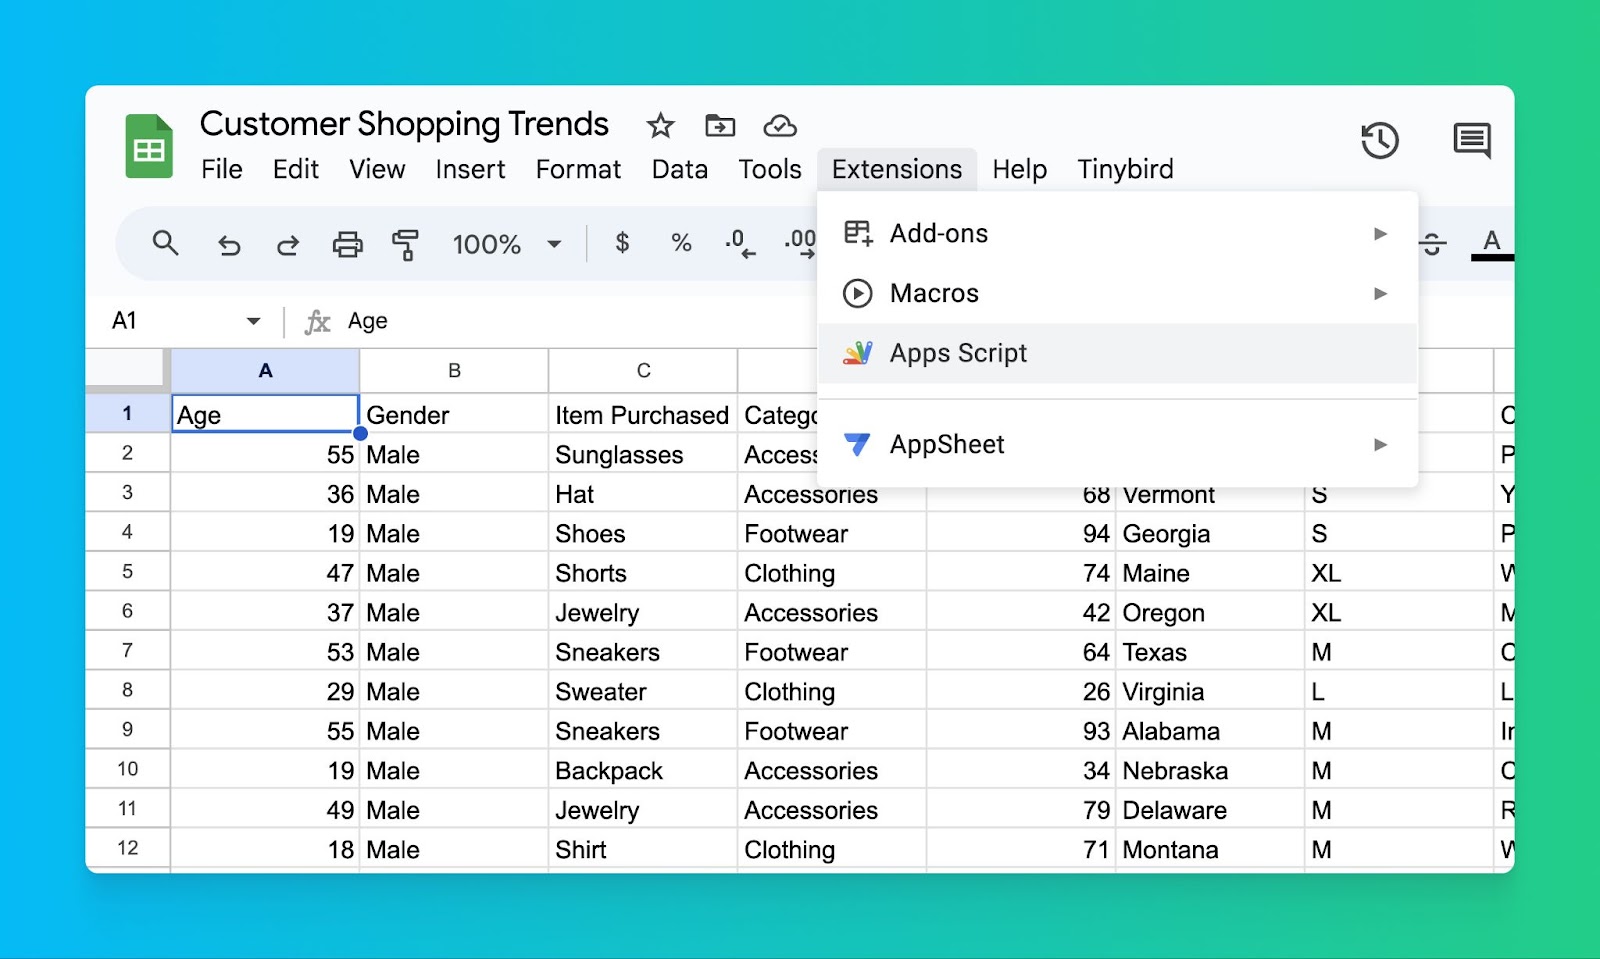
Step 3. Open Your Google Sheet
Open the Google Sheet containing the data you want to query with Tinybird. In this demo, we are using a sample data set of customer shopping trends (which you can download from our GitHub).
If you need to import this data set into Google Sheets, first download it to your machine, then in Google Sheets select “File > Import > Upload > Select a file from your device > Import data > Replace current sheet.”
Step 4. Write an Apps Script to sync data to Tinybird
Next, you need to add a script to your Google Sheet to tell it to send data to Tinybird. To do so, navigate to “Extensions > Apps Script” on the Google Sheet menu bar.
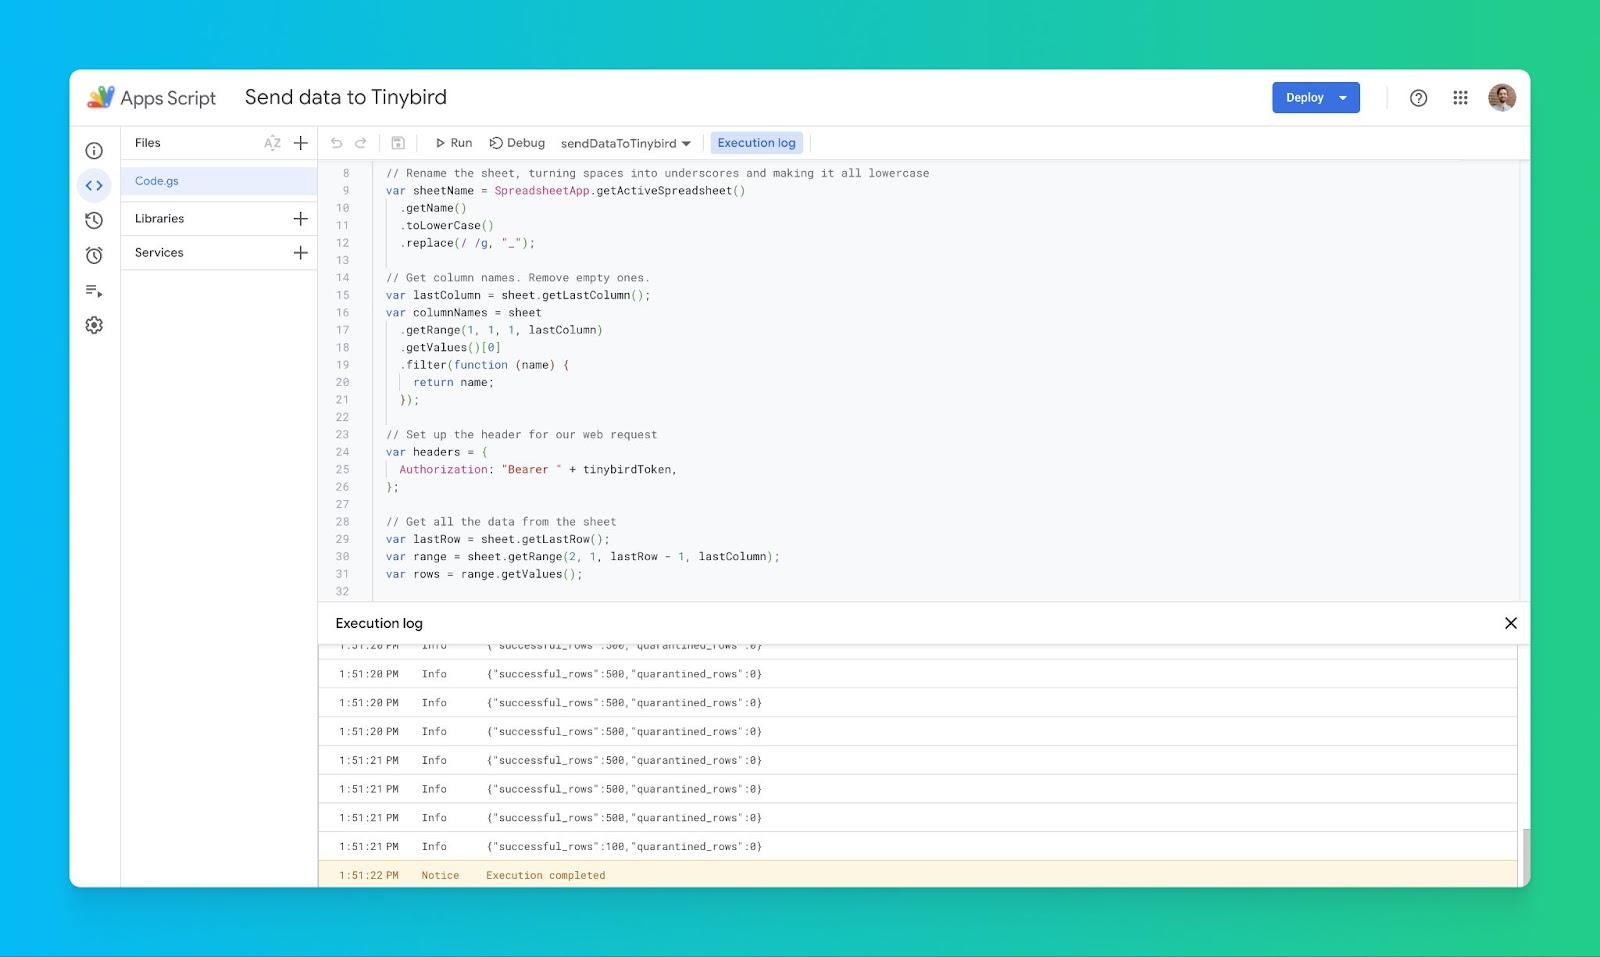
In the script editor, write or paste the code from the Code.gs file in the GitHup repo. To customize this code to your Tinybird Workspace, replace YOUR_TOKEN_HERE on line 6 with your actual Tinybird user token. In addition, you may need to update the API URL on line 64 with the correct API URL depending on your cluster. For example, a Workspace in a us-east cluster should use the URL https://api.us-east.tinybird.co/v0/events?name=.
Here’s what the Code.gs file looks like for me (though I’m obviously not sharing my user token 😉).
Step 5: Save and run the Script
Click the save icon or press Ctrl + S (Cmd + S for Mac).
Click “Run” in the Apps Script toolbar to execute the script. If it’s your first time running the script, you’ll need to grant it permission to access your Google Sheets data.
If there are errors, they'll be in the "Execution log" tab. Use Logger.log() for custom log messages in your App Script.
Step 6: Check that your data is in Tinybird
Navigate to your Tinybird Workspace. You should see a new Data Source with the name you added to the Apps Script in Step 5. If you used the default name, it will be the same name as your Google Sheet. You’ll notice that Tinybird’s Analyze API has automatically inferred the appropriate data types for the table based on the data you sent.

Step 7: Query your data with SQL
Start by creating a new Pipe in Tinybird. A Pipe is a way of writing chained SQL queries. You can break up your SQL into multiple nodes, and each Node can query the results from prior nodes. You can publish any Node in your Pipe as an API Endpoint.
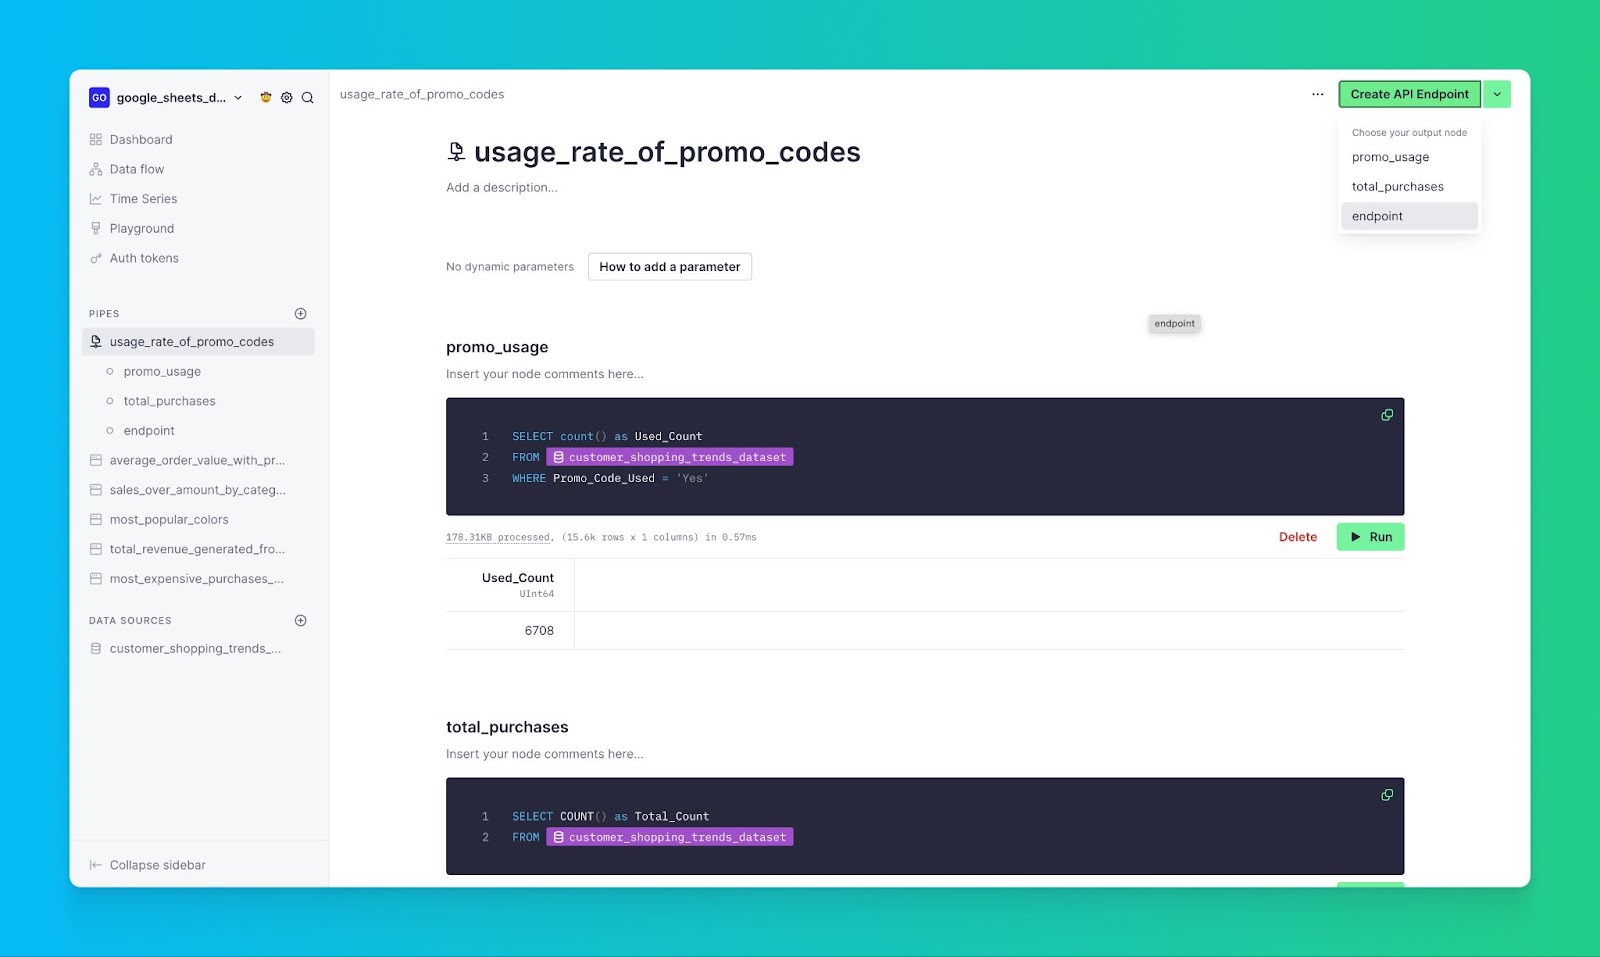
For example, here is a three node Pipe that calculates the usage rate of promo codes, titled usage_rate_of_promo_codes.
The first node, promo_usage, will determine the number of promo codes used.
The second node, total_purchases will get the total number of purchases.
A final node called endpoint brings these two queries together, retrieving the promo codes used and the number of times each code was used (Used_Count), and calculating the usage rate as a percentage of the total purchases.
In the repository, you’ll find several more .pipe files that define additional SQL queries for this example dataset. You can upload these files to the Tinybird server using Tinybird’s CLI.
Step 8: Create an API Endpoint
If you want to publish these metrics as an API Endpoint for use in real-time dashboards, user-facing analytics, or any other real-time data analytics use case, you can do that by selecting, “Create API Endpoint” and selecting the node you want to be published. In my case, that’s the node called endpoint.
From here, try pasting the sample HTTP sample into your browser, and you will be able to see the data from your SQL query, based on your data from Google Sheets, published as an API Endpoint. This Endpoint can be used to connect your Google Sheets data to other applications, real-time dashboards, or to share it with others as a fully documented data product.
Wrap up
You've achieved far more than a simple integration of Google Sheets with Tinybird; you've essentially unlocked a new realm of real-time data analytics capabilities. This combo is far from a one-trick pony. Let's unpack the expanded universe of what you can now accomplish.
- Enriching Data in Real-Time: Imagine your Google Sheet is tracking sales metrics. With Tinybird, you can automatically enrich that data with real-time inventory levels or customer data from your CRM, other APIs, or even another Google Sheet. This means you can create complex queries that pull from multiple data sources to generate on-the-fly insights, making your Google Sheet a centralized, real-time data hub.
- Advanced Dashboards: Sure, Google Sheets has built-in capabilities for charts and simple dashboards, but with Tinybird, you can take this to another level. Use Tinybird to pull data from your Google Sheets and build customized, dynamic real-time dashboards that can handle millions of rows of data in real time.
- Automated, Flexible Workflows: The API integrations don't stop at data enrichment. You can build out workflows that push data from Tinybird back into Google Sheets or into other applications, offering a two-way data highway. This could include triggering specific actions, like sending alerts or updating other databases when certain conditions in your Google Sheets data are met.
- Multi-Source Query Execution: Leverage SQL queries that can call upon multiple sources of data, not just Google Sheets. Your analytics can be as broad or as specialized as your projects require, whether it's marketing analytics or financial models
- Security and Scalability: Tinybird offers robust security protocols to keep your data safe, and its architecture is built for scalability. This means as your needs grow, your Google Sheets-Tinybird integration can easily scale along with them, all without compromising speed or data integrity.
To check out the complete codebase used for this tutorial, check out the GitHub repository.
To learn more about Tinybird, you can visit the website, check out the product documentation, or even get started for free with no credit card or time limit.
If you have questions about how Tinybird works, or how to build real-time data pipelines and APIs with Tinybird, feel free to join us on Slack.
FAQs
How secure is the Tinybird-Google Sheets integration?
The integration leverages Tinybird's robust security protocols. Data is transferred via secure methods, using Auth Tokens, which only authorized personnel can access. Security is built into both the data transmission and storage layers.
Is there a limit to the amount of data I can transfer from Google Sheets to Tinybird?
While Google Sheets itself has row and column limits, Tinybird is engineered for scalability. Its architecture allows for handling billions of rows, ensuring you can perform real-time analytics on large datasets without compromising on speed.
Can I use other data visualization tools along with Tinybird and Google Sheets?
Yes, the API Endpoints created in Tinybird can be used to feed data into other visualization tools like Tableau, Power BI, Grafana, or custom web dashboards. Tinybird essentially allows your Google Sheets data to be accessed in a standardized, API-friendly manner.
Is real-time data enrichment limited to specific types of data sources?
No. Tinybird can integrate with a variety of data sources, including CRMs, inventory management systems, streaming data platforms, data warehouses, and other third-party APIs. You can enrich your Google Sheets data with real-time information from multiple sources, making your analysis comprehensive.
Can I execute complex SQL queries using Tinybird and Google Sheets?
Absolutely. Tinybird's SQL engine is very powerful and designed for complex analytics queries. You can perform complex joins, aggregation functions, and filters on your data, even if it's coming from multiple sources. This allows for in-depth, real-time analytics directly using SQL.
What alternatives to Google Sheets should I consider for storing data?
Spreadsheets are a flexible way to interact and analyze tabular data, but they struggle when used as a database. As a simple replacement, you can consider a relational SQL database like Postgres, MySQL, or SQL Server. If analytics is your end goal, an OLAP platform like ClickHouse, Google BigQuery, or Tinybird will better serve your aims.