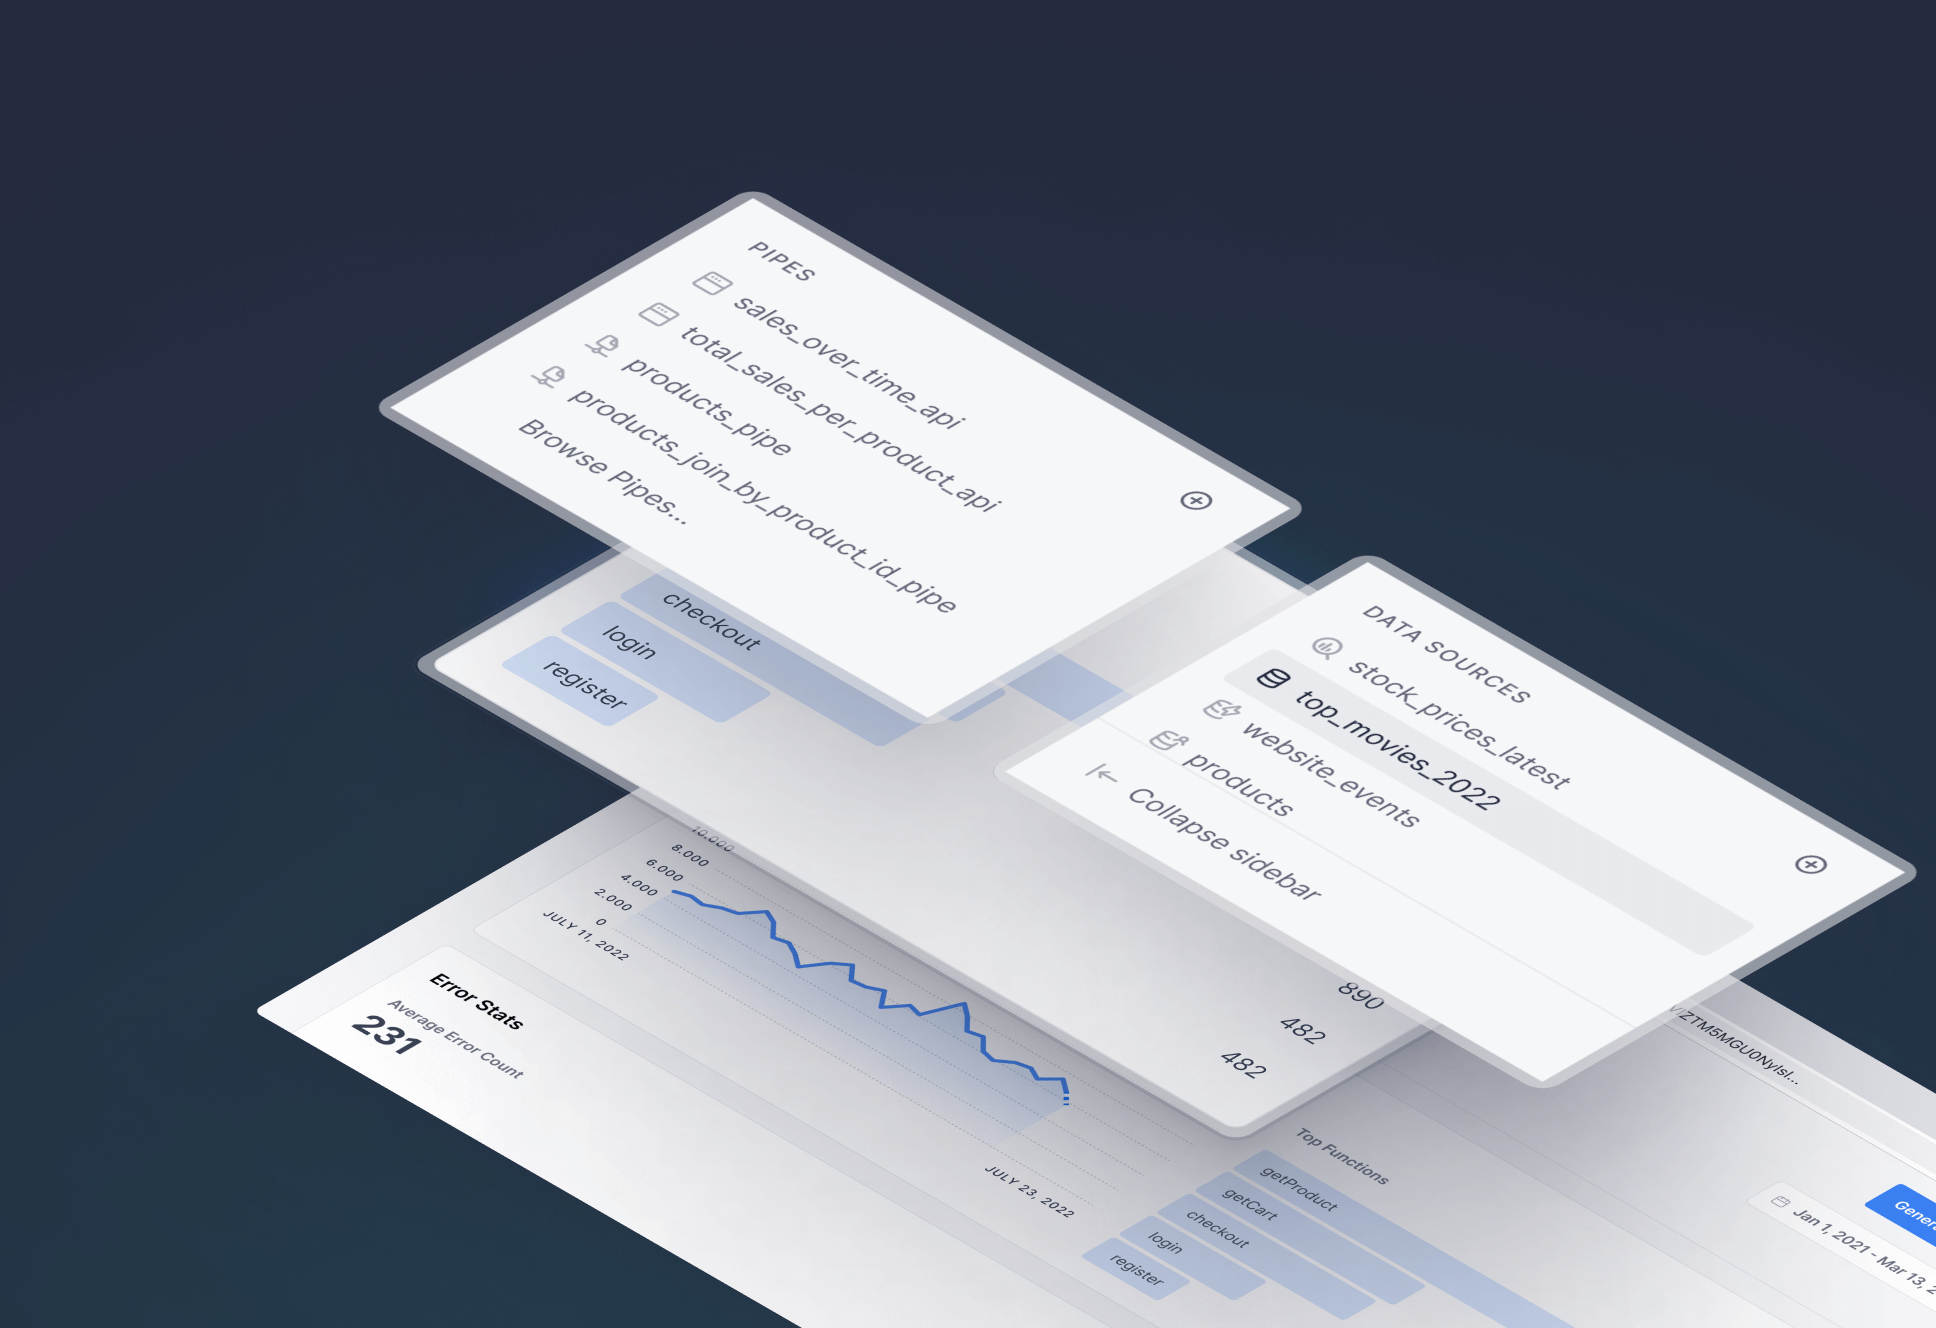
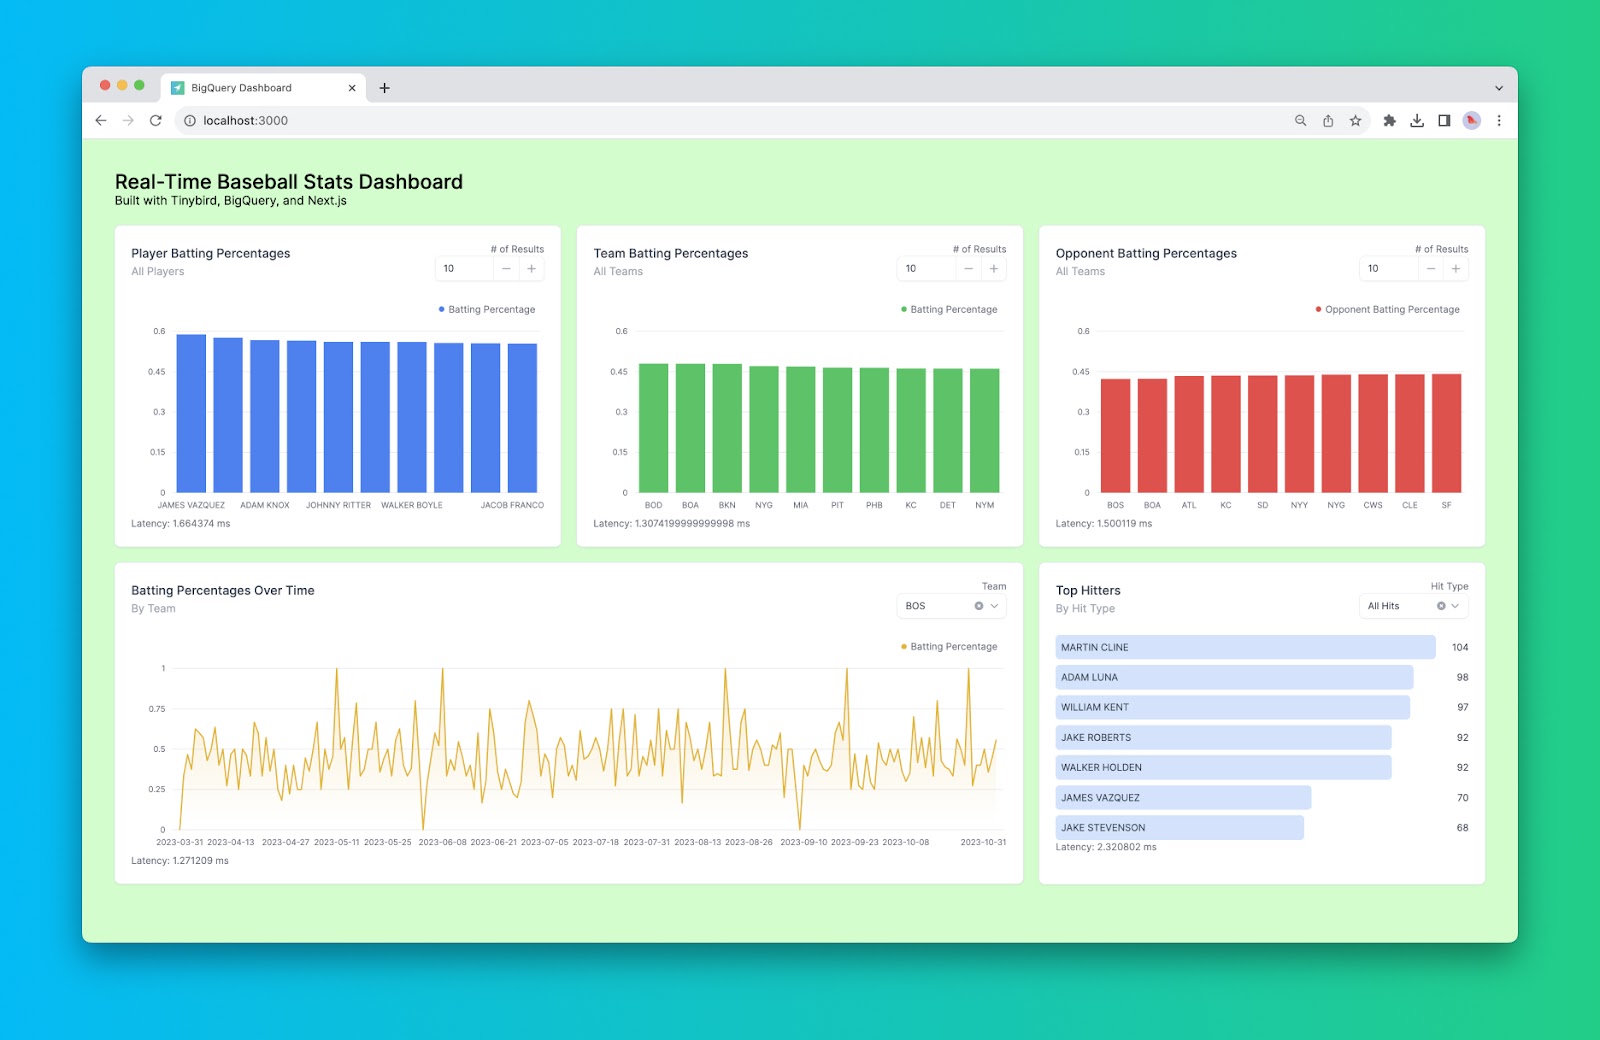
How do you build a real-time dashboard on top of BigQuery? That’s the question that this blog post answers via a step-by-step tutorial for building a real-time React dashboard app over BigQuery using Tinybird, Next.js, and Tremor components. This is what the final product looks like:
If you’d like to skip ahead to the tutorial, click here.
But first, let’s answer two questions:
- Why would you want to build a real-time dashboard over BigQuery?
- Why are traditional approaches to dashboarding with BigQuery not suitable for this use case?
Why create real-time dashboards over BigQuery?
Google BigQuery is a serverless data warehouse, offering powerful online analytical processing (OLAP) computations over large data sets with a familiar SQL interface. Since its launch in 2010, it’s been widely adopted by Google Cloud users to handle long-running analytics queries to support strategic decision-making through business intelligence (BI) visualizations.
Sometimes, however, you want to extend the functionality of your BigQuery data beyond business intelligence. One such extension is user-facing analytics: real-time data visualizations that can be integrated into user-facing applications. A growing trend emphasizes the importance of including real-time data visualizations in user-facing applications, so if your data is in BigQuery, you’ve come to the right place.
What is a real-time dashboard?
A real-time dashboard has three important qualities:
- It displays metrics calculated from real-time data that is often only seconds old (or less).
- It populates and refreshes visualizations in milliseconds.
- It supports concurrent requests from many users (thousands or millions).
Real-time dashboards are increasing in popularity as product teams seek to embed analytics into their applications. To support new data-driven features, these embedded analytics must be high-speed for many concurrent users.
Traditional ways to build BigQuery dashboards
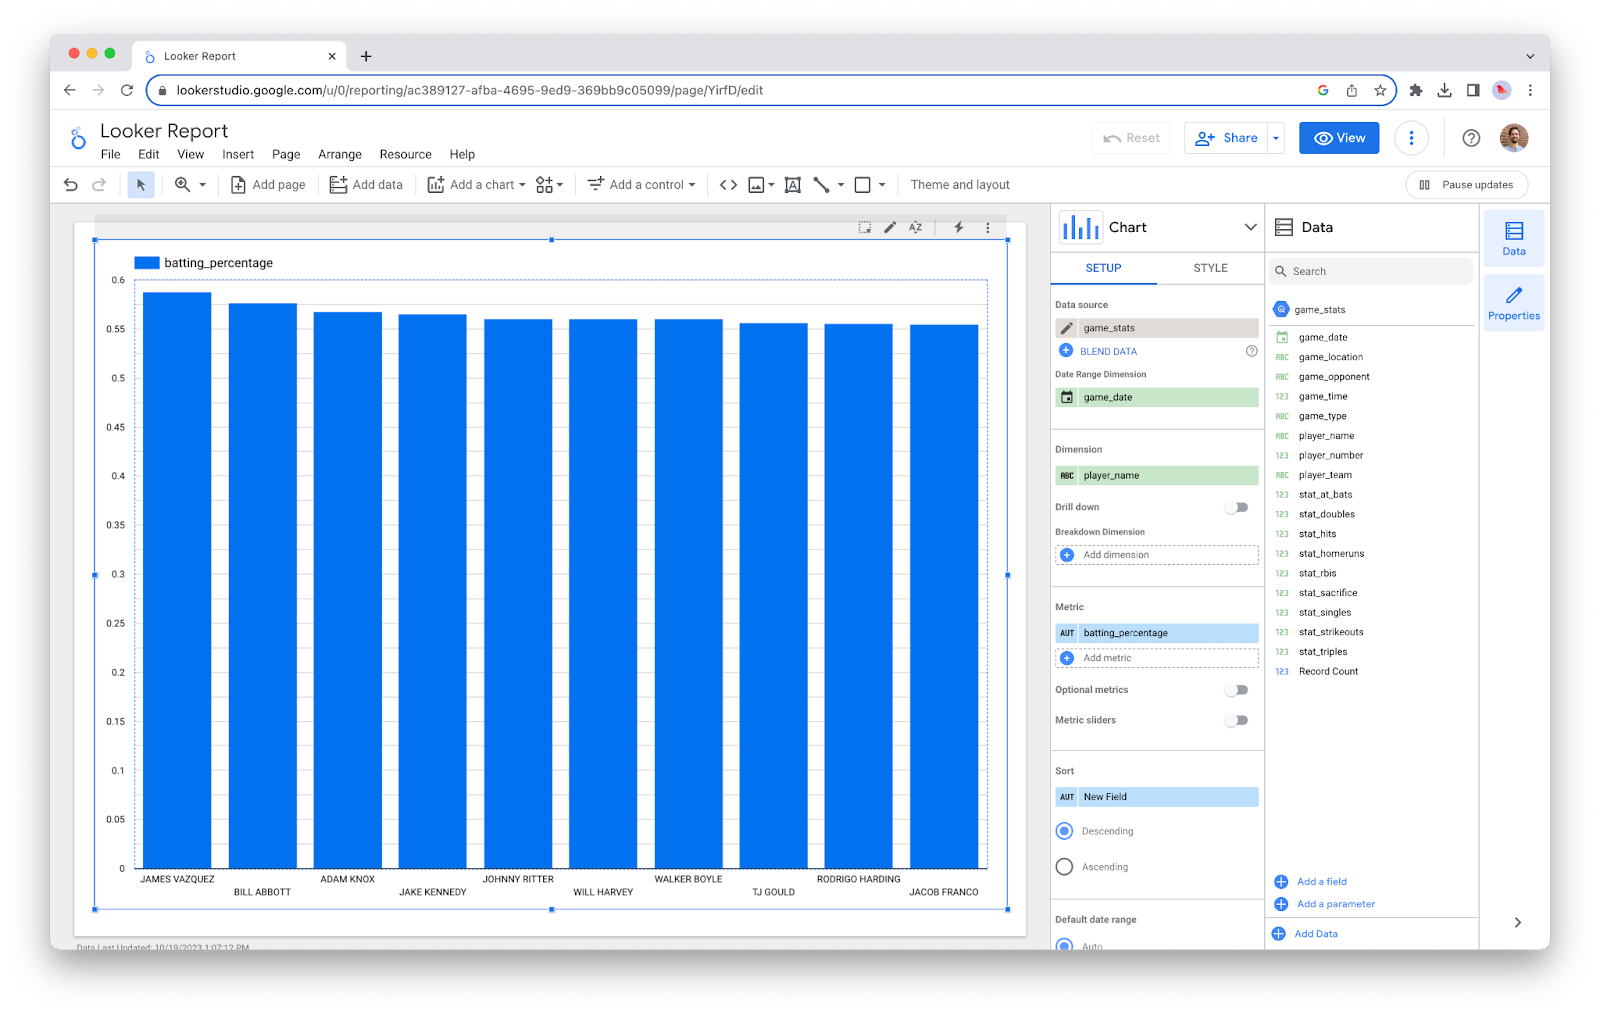
For Google Cloud Platform (GCP) users, the de facto method for building dashboards over BigQuery is with Looker and Looker Studio (formerly known as “Google Data Studio”).
Looker is a data modeling and business intelligence tool that can connect with data sources like BigQuery. With Looker, you can filter, aggregate, and enrich data sources to build new data models and tables. You can embed dashboards built with Looker into user-facing applications using iframes.
Looker Studio is a simple report-building tool that can connect to many different Google data sources, including BigQuery and Looker. With Looker Studio, you can import data sources and build reports to filter and aggregate those data sources in a visual manner. As with Looker, you can embed those reports into a web application or product using a simple iframe.
Why are Looker dashboards so slow?
Looker and Looker Studio are good business intelligence tools. If you use the two together, you can build comprehensive data models and consistent business metrics, and then construct dashboards to visualize them.
Unfortunately, these dashboards are often slow. The main culprits, according to Google:
- Too much data. Google mentions that datasets with “thousands” of data points can start to consume more memory.
- Too many dashboard elements. More frontend components can slow down your Looker experience.
- Autorefreshing too quickly. Google recommends avoiding autofreshing more frequently than 15 minutes.
- No caching. Google recommends leveraging caching (using datagroups or Google BI Engine) to speed up your query performance.
- Post-query computations are expensive. Want to create interactive dashboards that construct metrics on the fly? Beware of increased memory consumption.
- Too many columns and rows. If your queries return more data, your dashboards will slow down.
Why you can’t build real-time dashboards with BigQuery
Even if you follow all of Google’s recommendations to optimize Looker performance, you still won’t be able to build real-time dashboards over BigQuery.
Here’s why:
- Google BigQuery can’t handle user-facing concurrency. It’s designed for long-running analytical processes by a small number of concurrent users. Google BigQuery implements query queues that limit the number of queries that can be processed concurrently. By default, the query queue can only hold 1,000 interactive queries at once. If your dashboards make multiple queries, you’ll be limited to hundreds of concurrent users at best.
- Google BigQuery has a lot of query overhead. It’s rare to return any query in BigQuery in less than a second. That’s because BigQuery fundamentally isn’t a database, and it does many other things to handle metadata, initiate query operations, and return query responses. This often means that even simple queries over small datasets can take a few seconds.
- Google BigQuery isn’t built for streaming data. As a cloud data warehouse, BigQuery was designed for batch ETL/ELT processes that extract source data on infrequent schedules. By default, it won’t contain very fresh data.
Ways to speed up BigQuery for real-time dashboards
If you want to build fast dashboards over BigQuery for user-facing applications, you have some options:
- Use Google Cloud and BigQuery features to improve performance. Things like the BigQuery Storage Write API and BigQuery BI Engine can speed up BigQuery data through streaming ingestion and query caching, respectively. This can work if you don’t have large concurrency requirements and don’t need the fastest responses possible.
- Use an in-memory store to cache results. If all you want is to improve query response times from BigQuery, you can use an in-memory key-value store like Redis. Redis can cache and occasionally update Google BigQuery results, and speed up frontend performance by avoiding the need for requests to initiate a read from disk.
- Use a real-time data platform. If you need the trifecta of freshness, concurrency, and latency for your real-time dashboards, then use a real-time data platform like Tinybird. Tinybird can replicate your BigQuery tables into a full OLAP database optimized for reduced query latency on complex analytical queries. Unlike a cache, it can provide complete responses to interactive queries in milliseconds. It exposes queries as APIs that can be integrated directly into JavaScript, Python, or other such application code. And it supports streaming ingestion from other data sources to enhance freshness.
Step-by-Step: Build a real-time dashboard over BigQuery with Tinybird and Next.js
Now for the fun part, let’s build a real-time dashboard over BigQuery. To do so, we’re going to use Tinybird and its native BigQuery Connector. Tinybird will replicate BigQuery tables into its real-time database, enable us to build metrics for our dashboards with SQL, and expose those metrics as APIs that we can integrate into our frontend code.
To build an interactive dashboard, we’ll be creating a Next.js app that utilizes Tremor dashboard components. This builds off of another real-time dashboard tutorial we published for streaming data sources.
You can follow along below, or deploy the entire project by cloning the GitHub repo, setting up your individual resources in BigQuery and Tinybird, and deploying it.
Let’s dig in.
Step 1: Set up a free Tinybird Workspace
Tinybird will serve as the real-time analytics engine that powers our real-time dashboard. To use Tinybird, sign up for a free account here and create a Workspace. I’ve called my Workspace bigquery_dashboard.
Step 2: Connect your BigQuery dataset to Tinybird
To get your BigQuery data into Tinybird, you’ll use the Tinybird BigQuery Connector. Follow the steps in the documentation to authorize Tinybird to view your BigQuery tables, select the table you want to sync and set a sync schedule.
In this tutorial, I’ve created a small sample dataset that contains 20,000 rows of fake baseball stats. If you want to follow along, you can download it from the repo and upload it to your BigQuery project.
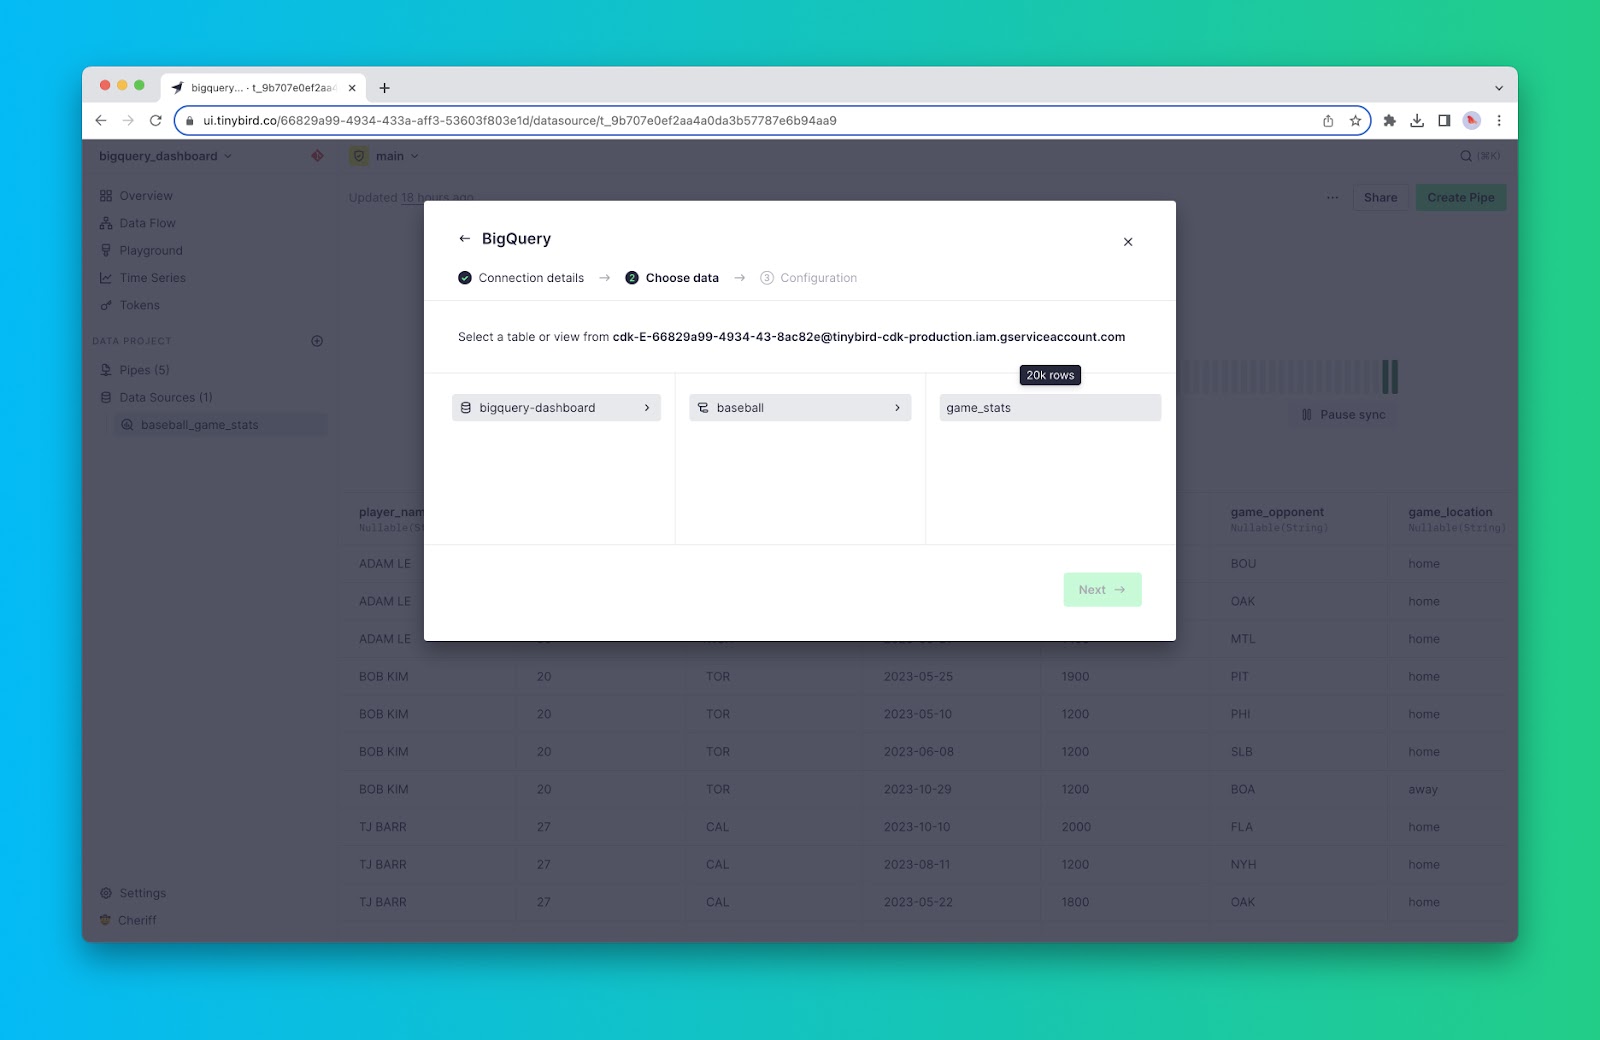
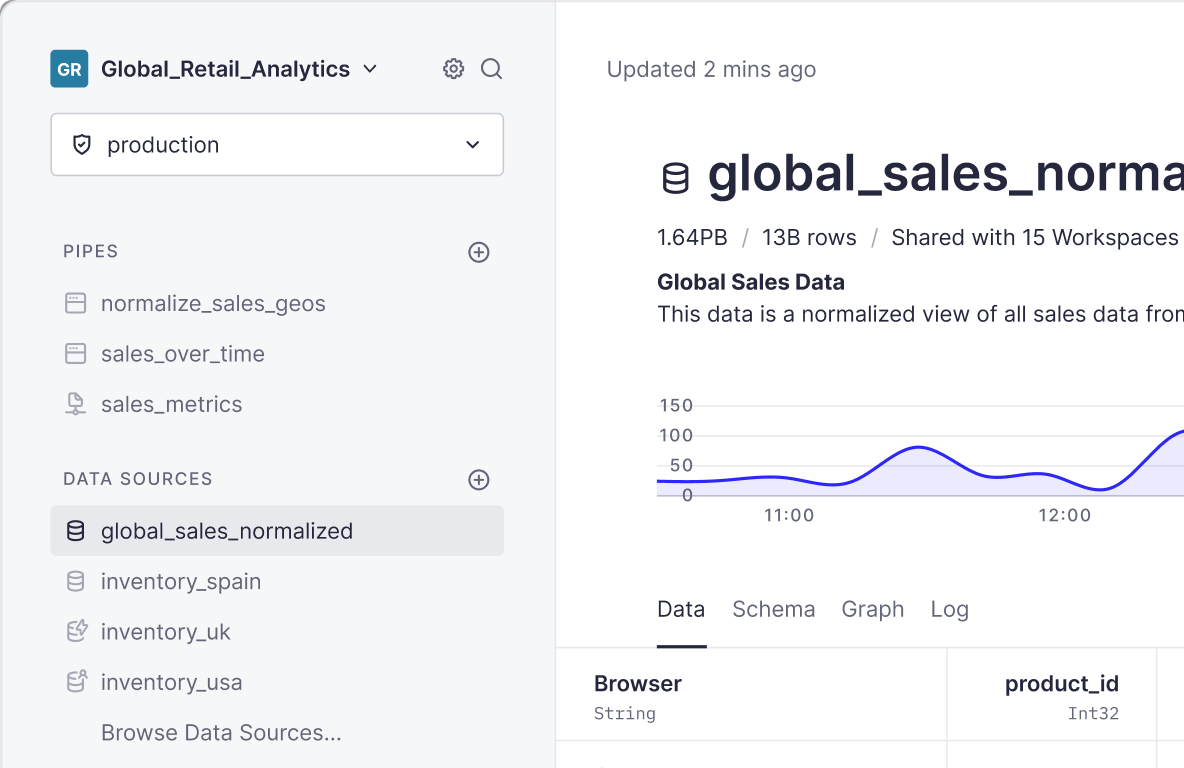
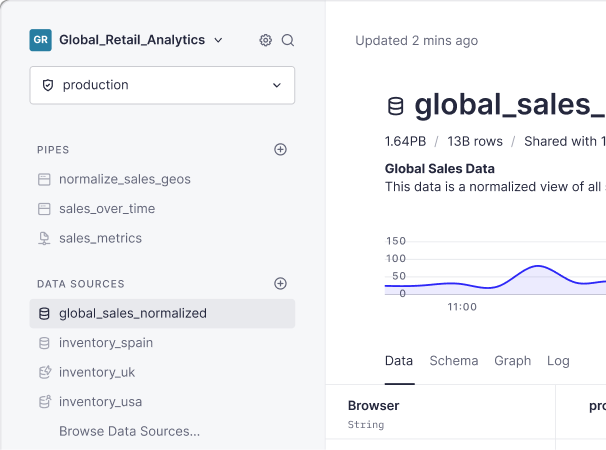
Tinybird will copy the contents of your BigQuery table into a Tinybird Data Source and ensure the Data Source stays in sync with your BigQuery table.
Step 3: Create Pipes
In Tinybird, a Pipe is a transformation definition comprised of a series of SQL nodes. You can build metrics through a series of short, composable nodes of SQL. Think of Pipes as a way to build SQL queries without always needing to write common table expressions or subqueries, as these can be split out into independent nodes.
Here, for example, is a simple single-node Pipe that calculates the season batting average for each player:
You can create a Pipe from the BigQuery Data Source you just added by clicking “Create Pipe” in the top right corner of the Tinybird UI.

Step 4: Extend your Pipes with Query Parameters
Every good dashboard is interactive. We can make our Tinybird queries interactive using Tinybird’s templating language to generate query parameters. In Tinybird, you add query parameters using {{<DateType>(<name>,<default_value>}}, defining the data type of the parameter, its name, and an optional default value.
For example, I can dynamically change the number of results I return from the above Pipe with a limit parameter and a default value of 10:
Step 5: Publish your Pipes as APIs
The magic of Tinybird is that you can instantly publish your Pipes as fully-documented, scalable REST APIs in a click. From the Pipe definition in the Tinybird UI, click “Create API Endpoint” in the top right corner, select the node you want to publish, and you’re done. Make sure to name your Pipe something description, as the Pipe name will be used as the URL slug for your API endpoint.
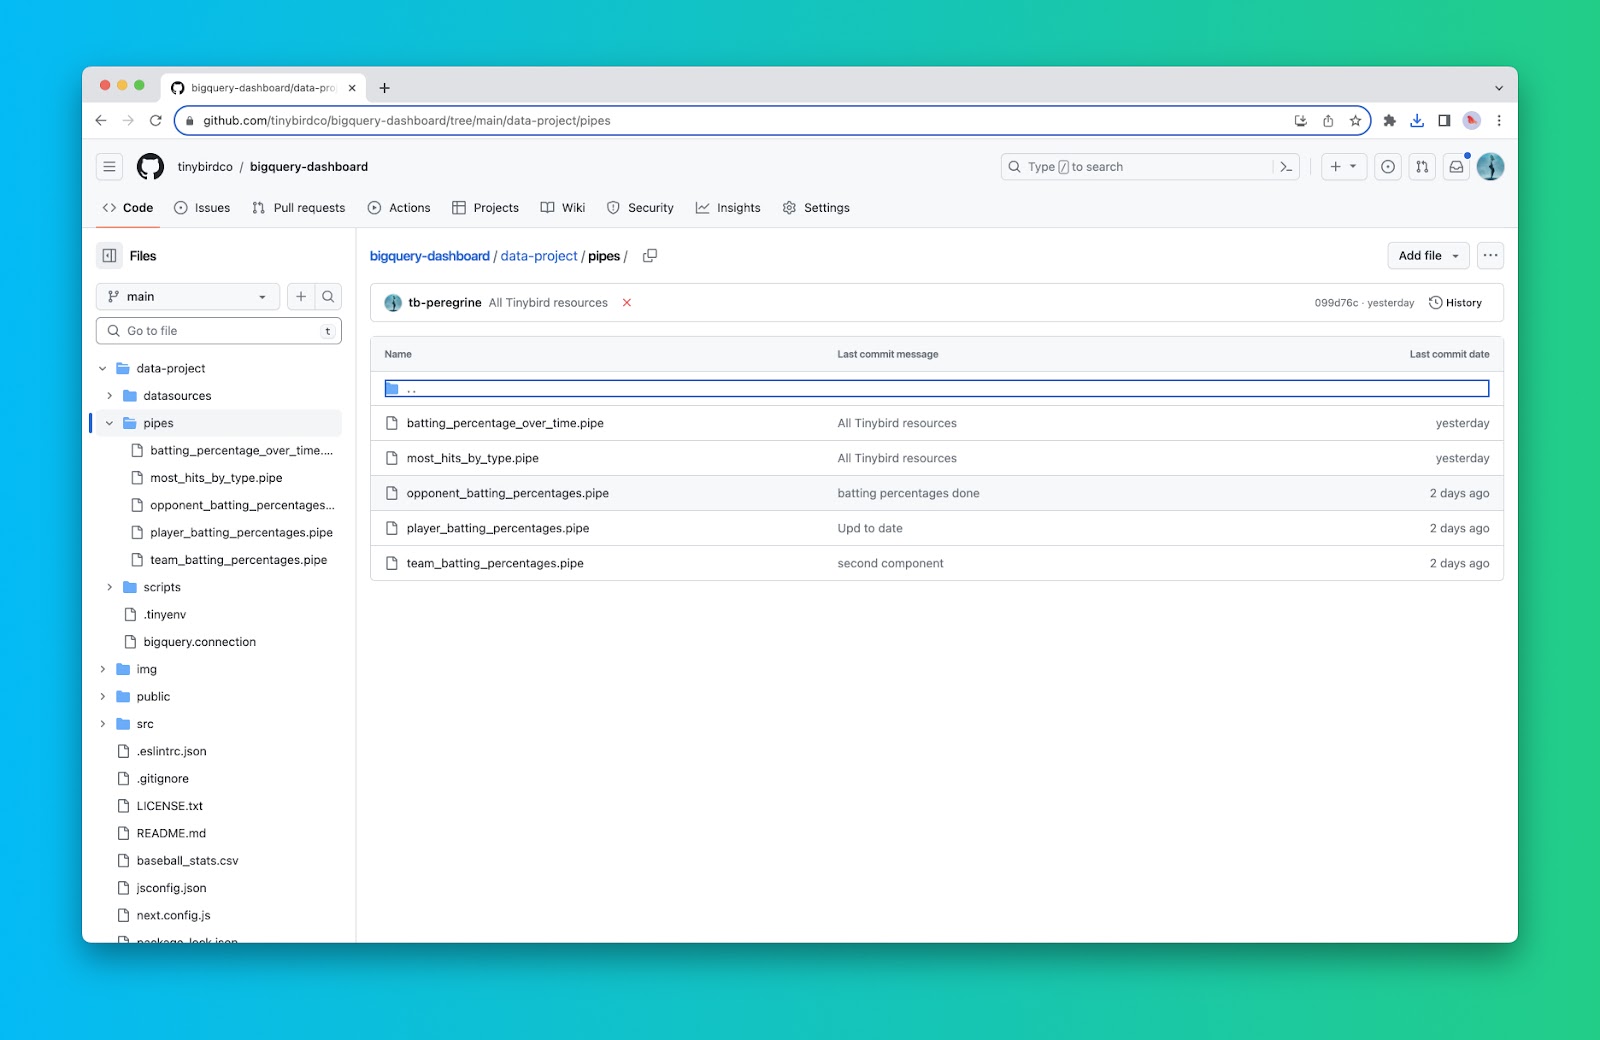
In the project repository, you’ll find 5 .pipe files in the pipes/ directory that define the 5 API endpoints we’ll use to build our real-time dashboard:
Step 6: Create a Next.js app
Create a Next.js app as follows:
Tinybird APIs are accessible via Auth Tokens. In order to run your dashboard locally, you will need to update your env.local file with the following:
Step 7: Define your APIs in code
To support the dashboard components you’re about to build, you might find it helpful to create a helper file that contains all your Tinybird API references. In the project repo, that’s called tinybird.js and it looks like this:
Step 8: Build your dashboard components
For this tutorial, we’re using the Tremor React library, because it provides a clean UI out of the box with very little code. You could easily use ECharts or something similar if you prefer.
Our dashboard contains 3 Bar Charts, 1 Area Chart, and 1 Bar List. We’ll use Tremor Cards to display these components, and each one will have an interactive input. In addition, we’ll show the API response latency underneath the chart (just so we can see how “real-timey” our dashboard is).
Here’s the code Player Batting Averages component (playerBattingPercentages.js):
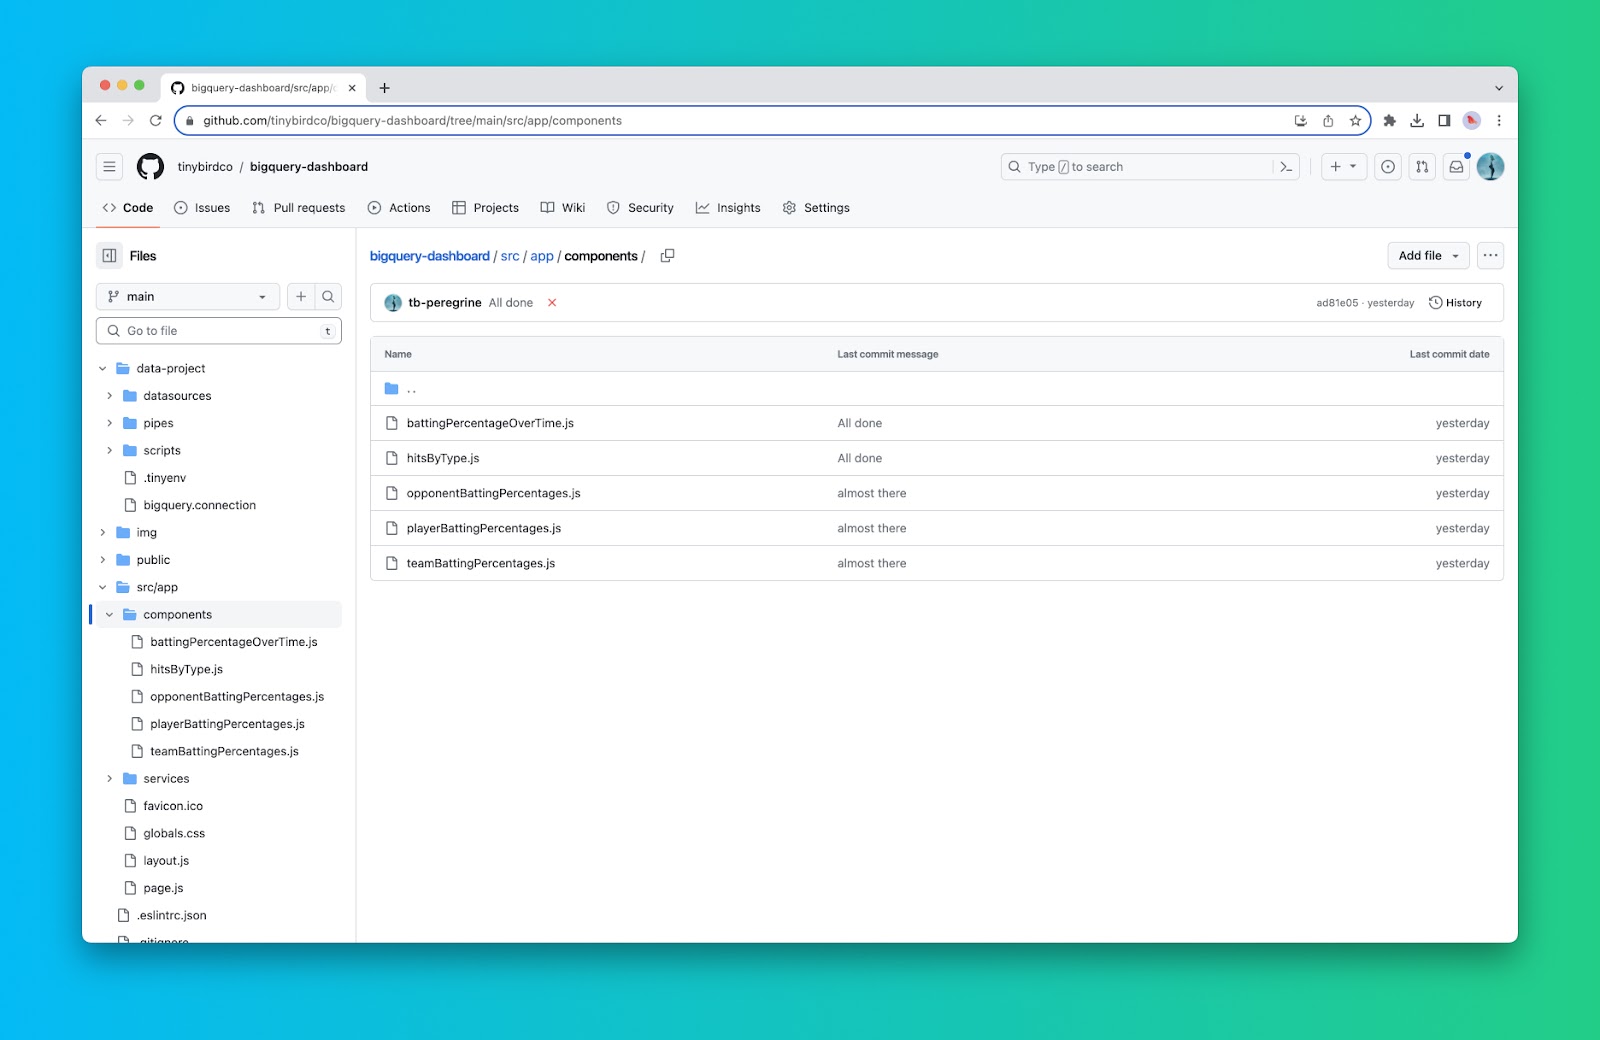
You’ll find 5 total dashboard components in the src/app/components directory of the repository. Each one renders a dashboard component to display the data received by one of the Tinybird APIs.
Step 9: Compile your components into a dashboard
Finally, you’ll update your page.js file to render a nicely laid out dashboard with our 5 components. This file gets your Tinybird Auth Token from your local environment variables to be able to access the Tinybird APIs, then renders the 5 components we just built in a Tremor Grid.
To visualize your dashboard, run it locally with npm run dev and open http://localhost:3000. You’ll see your complete real-time dashboard!
Notice the latencies in each dashboard component. This is the Tinybird API request latency. Note this is NOT using any sort of cache or query optimization. Each request is directly querying the 20,000 rows in the table and returning a response. As I interact with the dashboard and change inputs, the APIs respond.
In my case, that’s happening in just a few milliseconds. Now that’s a fast dashboard.
Real-time analytics for BigQuery with Tinybird
In this tutorial, you learned how to build a real-time JavaScript dashboard over BigQuery using Tinybird and Next.js. Tinybird is the real-time analytics platform that makes this possible. With Tinybird, you can quickly sync BigQuery tables into a platform optimized for real-time analytics, create metrics with nothing but SQL, and publish those metrics as real-time APIs that scale to support thousands or millions of concurrent requests.
If you need to reduce latency with BigQuery, whether to build real-time dashboards or any other user-facing analytics feature, Tinybird can be extremely useful. You can learn more about Tinybird by visiting the website, checking out the documentation, or requesting a demo. If you’re ready to start building, you can sign up for free here.