This is a story about completely saturating a ClickHouse replica (and being happy about it). We were able to fix a long-running issue that limited our query concurrency, and we increased CPU utilization to 100% in the process.
The unknown limit
The story begins about a year ago. One of our ClickHouse clusters started to malfunction, causing some queries to slow down significantly. At first glance, everything seemed fine. We checked the usual bottlenecks - CPU, memory, I/O - and all checked out. But still, at a certain number of requests per second, query responses on the replica would slow down. We couldn't figure out why.
We spent days digging into different metrics, checking query performance, assessing required resources, tweaking cloud provider settings, and many other things. We had many more hypotheses than we had real solutions. Maybe we could find and resolve some hidden bandwidth limits or improve concurrency by limiting the number of threads used per query? Everything was pointing to some kind of contention, but we couldn't see it. "We must be missing something" was a common refrain in those days.
As engineers, we would have loved to dive deep into this issue, understand what was happening, and develop some novel fix. But we have to balance our itch to solve problems with some pragmatism; we still have a real-time data platform to build, customers to support, and features to release. So we made a quick fix, slightly changing the cluster setup and isolating some workloads so we could move on to the next GitLab issue.
Some context about Tinybird and ClickHouse
Tinybird is a real-time platform for data and engineering teams. We give our customers the power to unify data from many source systems (including databases, data warehouses, and streaming data), develop real-time analytics with SQL, and publish their queries as low-latency, scalable APIs.
We are focused primarily on streaming ingestion and real-time use cases; our clients can ingest millions of events and make thousands of concurrent API requests per second. Under the hood, we use ClickHouse as our primary analytical database and real-time SQL "engine". ClickHouse is an incredibly powerful open-source database, and we only use a subset of its features. Still, with the scale we support and our customers' latency and throughput requirements, we often push it to the limit.
ClickHouse is an incredibly powerful open-source database, and we only use a subset of its features. Still, with the scale we support and our customers' latency and throughput requirements, we often push it to the limit.
As such, we frequently contribute to the ClickHouse project by developing performance improvements that help us continue to support our customers' scale.
Finding the root cause
Despite our quick fix, this resource contention became a recurring issue. We've been able to dodge it by deploying more quick fixes, but that changed a few weeks ago. To be able to support a particular use case for one of our clients, we were approaching a scale that made it impossible to ignore It was time to invest in the time and resources to fix it for good.
We had been able to avoid fixing this problem for almost a year, but certain customers began approaching a scale that made it impossible to ignore.
Every time we had faced this issue before and explored various metrics and profile events, we ended up in the same dead end. We saw lock-related profile events such as RWLock* and discarded them since we knew they were not the root cause but merely a symptom.
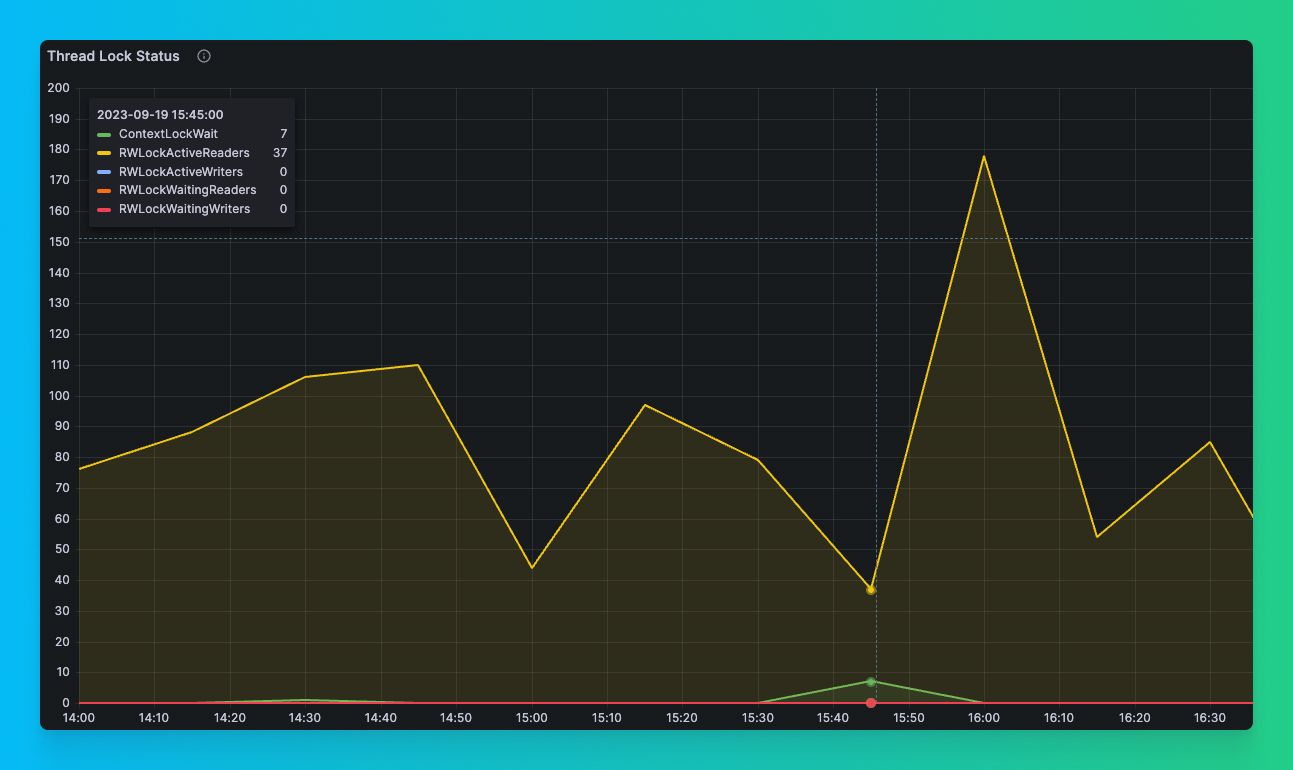
ContextLockWait eventsThis time was different. We noticed a small peak of ContextLockWait events. After all this time surveying typical server metrics for clues and coming up empty, we finally had something promising!
Unfortunately, we didn't have a good way to measure its impact on performance. Unlike RWLock* events, which have *WaitMilliseconds properties that indicate how long they've been waiting to acquire the lock, ContextLockWait events don't come with a time-based equivalent that would have let us measure the time waiting for those locks. So we were flying blind, with no way to understand the consequences of these events.
In ClickHouse,ContextLockWaitevents didn't come with an equivalent time-based wait property, likeRWLockWaitMilliseconds, that would have allowed us to measure the performance impact of these events.
We decided to dump all threads during the incident and see if we could extract something from there. After a first look at the dump, it was clear that ContextLock was, at least, one of the issues.
So, we built a small reproducer to report the issue to the ClickHouse repository to help the contributors with the fix. While working on the reproducer, we sent the first improvement upstream, adding a profile event to report Context Lock waiting time. With this metric available, it became easy to find a query that, given sufficient concurrency, would cause the same contention we were seeing in our clusters. This moved our first roadblock out of the way.
We built a small reproducer and pushed a change to add a waiting time profile to ContextLock events in ClickHouse.
With the reproducer in place and a way to measure the impact of the contention, it was just a matter of digging into the code and figuring out how to reduce contention and improve performance. After quite a big refactor spearheaded by my colleague Maksim Kita, we managed to remove lock contention, reducing the impact on our synthetic example by an order of magnitude.
Here's how we did it:
Context refactoring
Here's the basic architecture of Context in ClickHouse before the refactor:
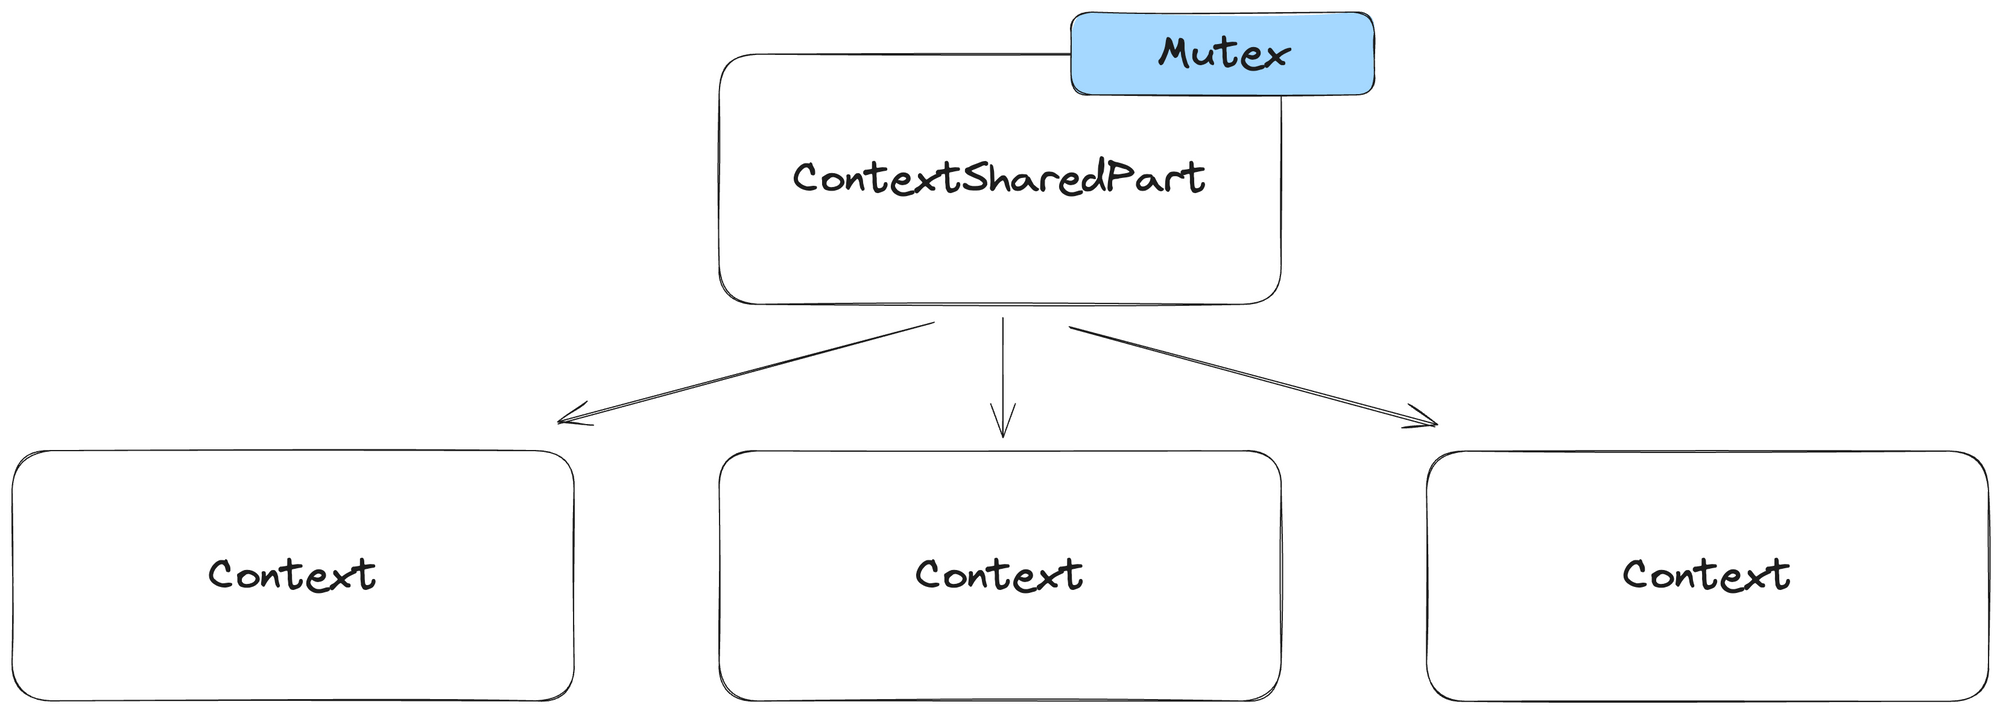
ContextSharedPart and Context instances all shared a single global mutex. In ClickHouse, ContextSharedPart is responsible for storing global shared objects that are shared between all sessions and queries, for example:
- Thread pools
- Server paths
- Global trackers
- Clusters information
ContextSharedPart also provides a lot of useful methods for working with these objects with synchronization.
Context is responsible for storing query- or session-specific objects, for example:
- Per query settings
- Per query caches
- Current database
Context also provides a lot of methods for working with these objects, and also it uses ContextSharedPart to provide some of that functionality.
During query execution, ClickHouse can create a lot of Contexts because each subquery in ClickHouse can have unique settings. For example:
In this example, a nested subquery will have max_threads = 16, requiring its own Context.
The problem was that a single mutex was used for most of the synchronization between Context and ContextSharedPart, even when we worked with objects local to Context. A large number of low-latency, concurrent queries with many subqueries will create a lot of Contexts per query, and the problem becomes even bigger.
We did a big refactoring, replacing a single global mutex with two read-write mutexes. One global read-write mutex for ContextSharedPart and one local read-write mutex for each Context. We used read-write mutexes because most of the time we do a lot of concurrent reads (for example read settings or some path) and rarely concurrent writes.
In many places, we completely got rid of synchronization where it was used for initialization and used call_once for objects that are initialized only once.
The Context architecture after our refactor
Here's the way things looked after our refactor:
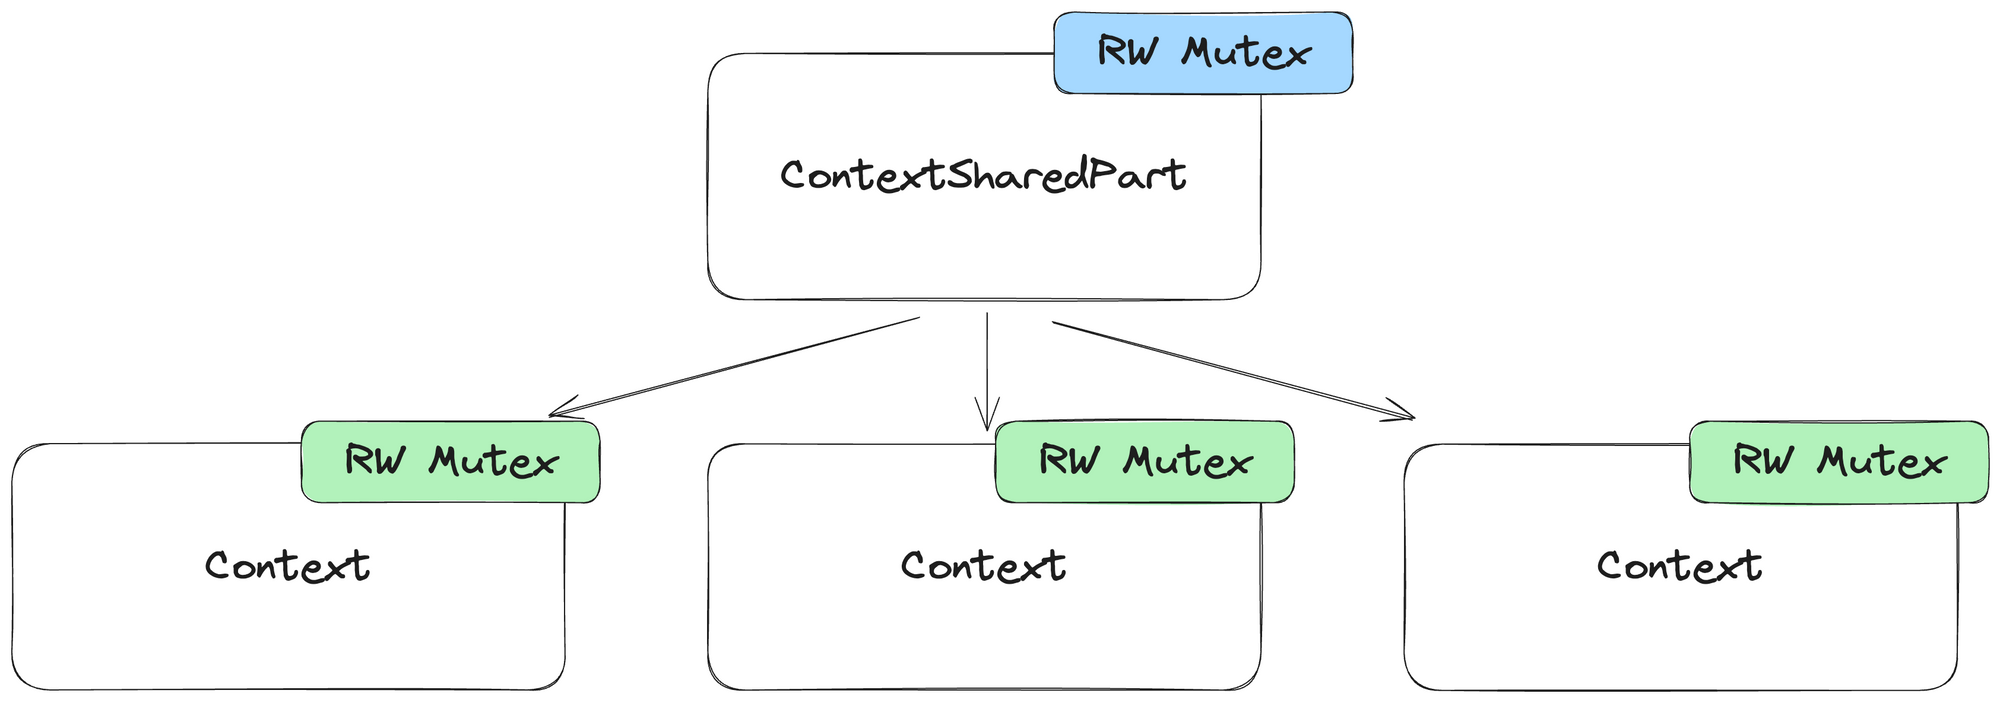
Context had its own read-write mutex.We also added clang ThreadSafetyAnalysis (TSA) annotations, so we can be sure that our refactoring does not introduce race-conditions or deadlocks.
Bringing the CPU to 100%
Once both changes were accepted and merged to ClickHouse master we decided to run some tests in a production-like environment. The main objective was to see if we could reproduce the issues and assess the impact of the fix by simulating our clients' workload on two different ClickHouse versions.
- 23.9: Contains the metric to measure the impact
- master: Contains the
ContextLockfix
So, we recreated the databases and tables, extracted 1,000 example queries from the last seven days, and ran them continuously for a few minutes using clickhouse-benchmark with enough concurrency:
Results with 23.9
Here are the results we saw on 23.9, where we implemented a way to monitor the impact of the Context lock contention:
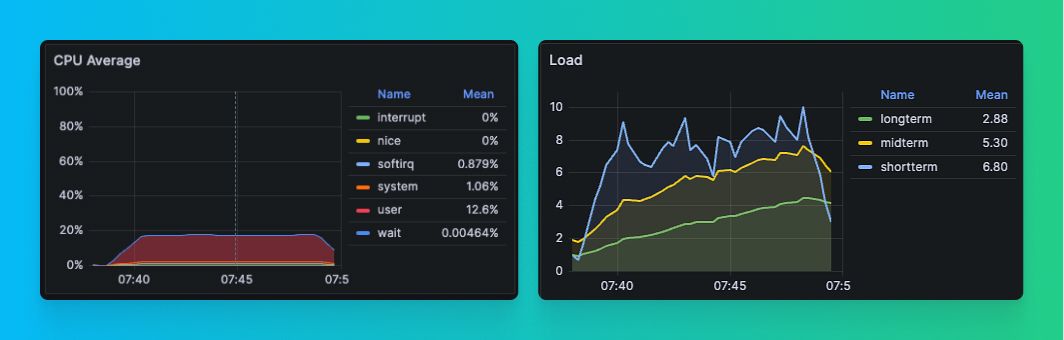
From these results, you can see that, as a baseline, we were able to achieve these results:
- ~200 QPS
- CPU utilization of only ~20%.
- Half of queries took at least 1s
- Slowest queries took ~75s
Results with master
Here are the results we saw on master, where we had refactored Contexts to attempt to resolve our lock contention:
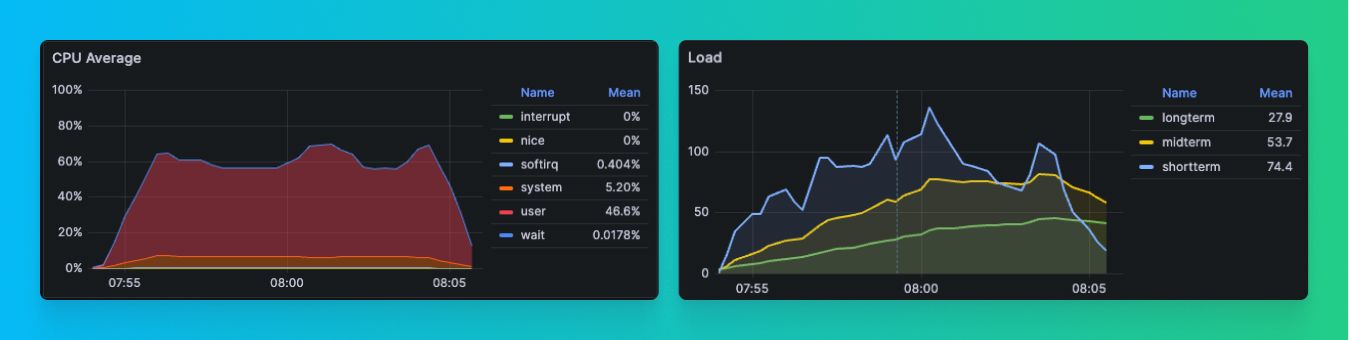
concurrency=500 we were able to 3x performance.With the refactor, we managed these results:
- ~600 QPS (~3x better)
- CPU utilization to ~60% (~3x better).
- Median query time to ~0.6s (~2x better)
- Slowest queries to ~6s (~12x better)
Since tests with master were successful, we added more concurrency to clickhouse-benchmark (1000 instead of 500) to see what would happen. Here are the results:
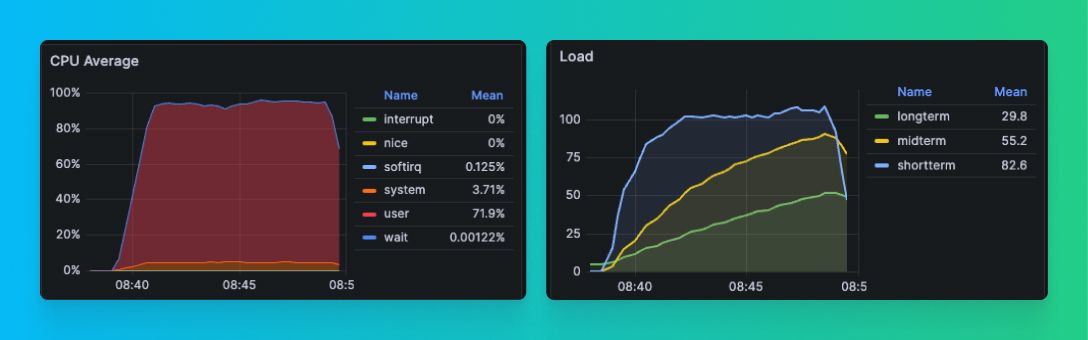
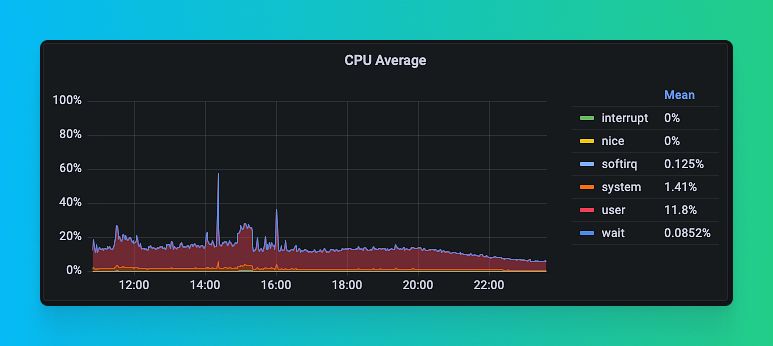
These results are incredible:
- ~1,000 QPS (~5x better)
- ~100% CPU utilization (~5x better)
- 0.033s median response time (~30x better)
- Slowest queries ~4s (~20x better)
Of course, these are just tests, and we don't expect to get a 5x improvement in production, since we certainly will find other bottlenecks with I/O, CPU, and/or memory. But, we have at least removed a contention that had stumped us for a long time. Even if all we got was a 1.5x bump in performance, this is a massive improvement for us, our infrastructure, and the customers who use it.
We don't expect to get a 5x boost in production, but even if it's just 1.5x, that's still a massive improvement for us and our customers.
With the ClickHouse 23.10 official release (slated for November 2nd), we will update some of our most performance-demanding clients, and see the real impact of these changes.
We expect good things.