With Tinybird we aim to make it extremely easy to exploit huge quantities of data through simple-to-create API Endpoints. You can easily ingest data, craft SQL queries over it and expose the result as APIs for others to consume, inside or outside of your organization.
But once you have published those endpoints, then what? How do you track if/how much they are being used? How do you know if they are performing as fast as you would want them to or if they are throwing errors? Knowing all of these things enables you to react quickly if things go wrong, and is an integral part of operating a set of API endpoints - an API hub - while providing an outstanding service to those who consume them.
The same goes for Data operations; we all know ingestion processes sooner or later fail: the quality of the data is not always what it should be, formats some time change, connectivity may falter, etc. When you set up your Analytics, you need to be able to trust the data that is coming in so that you can be sure that your insights are correct: keeping a tight control over your ingestion jobs is a key part of that.
In fact, we believe that such level of control is so key that we have decided to make those things the first thing you see when you login to your Tinybird account: the new Tinybird Analytics Dashboard.
After a few weeks iterating over what were the critical set of tools required for anyone to monitor their Tinybird account, we’ve released a new dashboard. Thanks to it, you can see in real-time how your API endpoints are performing and monitor your data operations.
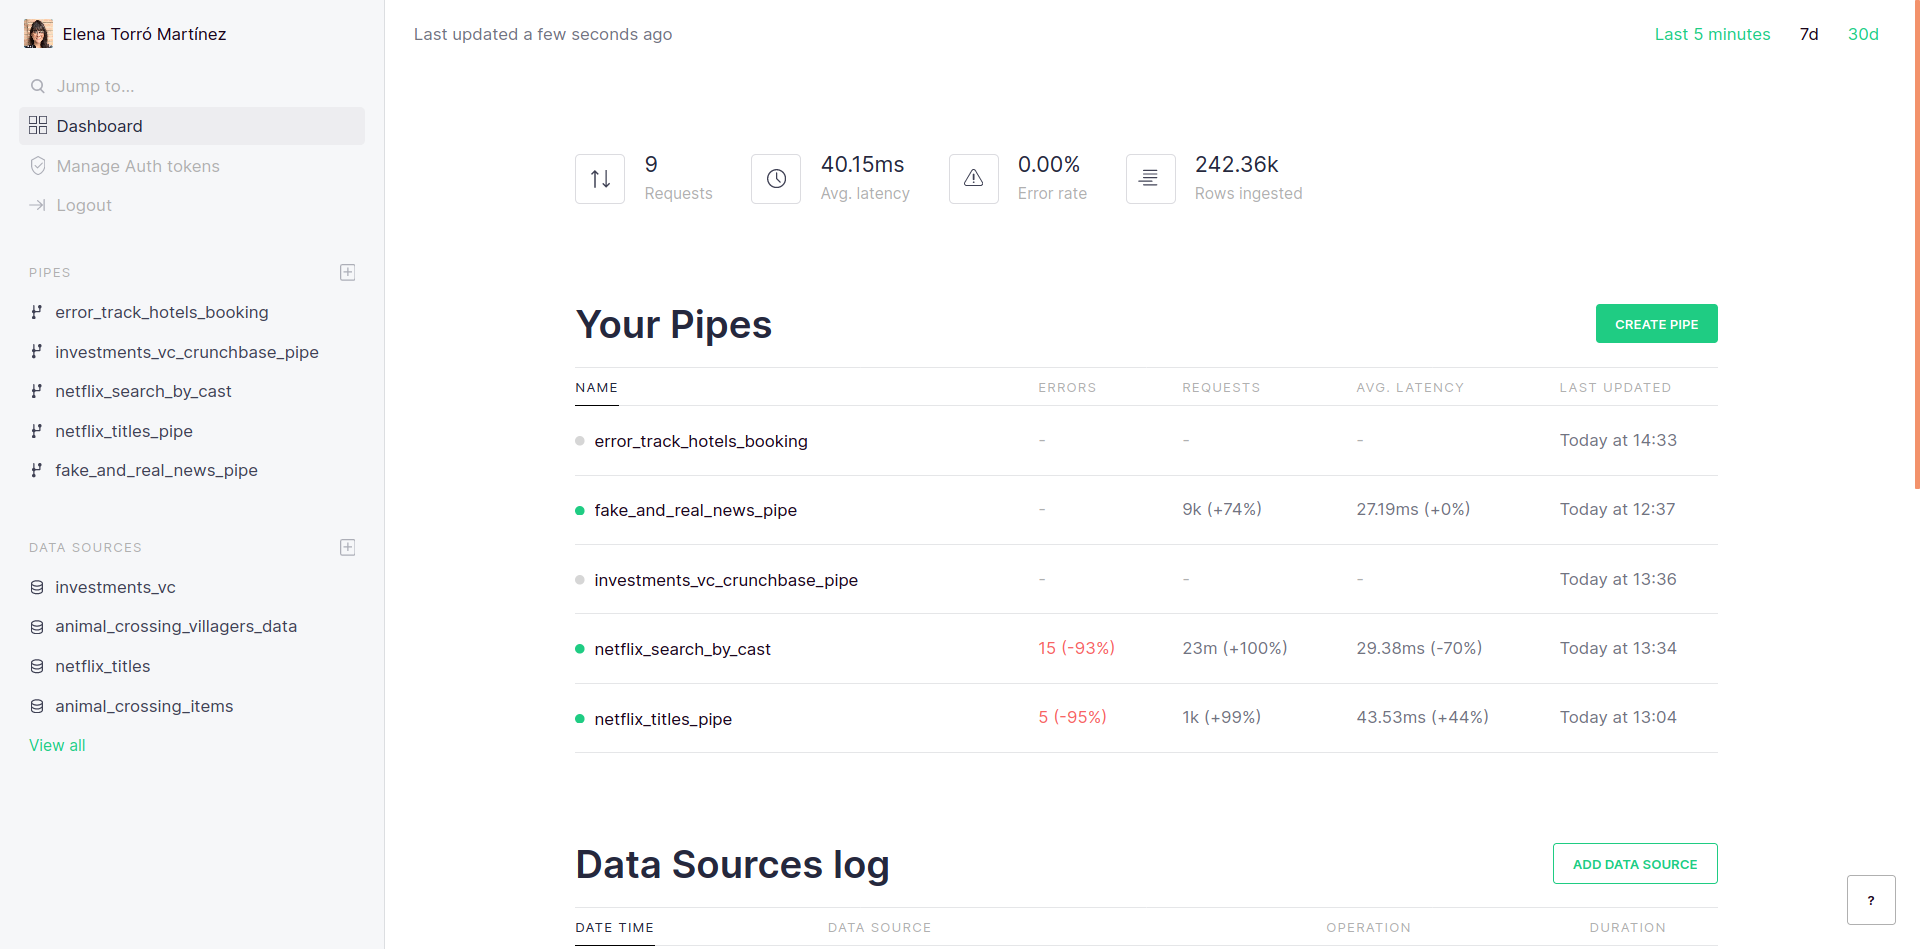
How your API endpoints are performing
Among other things, in the new dashboard you can see the avg latency time, the number or requests and the number of errors for each endpoint which, combined, are a good indicator of how things are going with your existing API endpoints.
The dashboard leverages our Service data sources, so all the raw data we use to build this dashboard is accessible to you, so you can build your own API Endpoints on top of it, to power your own monitoring system, create alerts, visualize latency or number of requests to understand how your APIs performance has evolved over time, detect potential bottlenecks, etc.
Monitoring your data operations
Below your API endpoints information, you can find a simplified version of the recently launched Data Source Operations Log, which gives you a quick view of the latest operations run over your Data Sources (ingestion, creation, replacement, etc…), in an actionable way.
As you can see, we group similar operations to make the log easier to read, or highlight those operations that errored out or went partially wrong.
As with the API endpoints performance module, all the raw data about Data Sources operations is accessible to you as well via SQL.
We believe the new dashboard is a good way of tracking how everything’s going in our own accounts, so we hope you find it useful as well. If there’s anything you are missing, or anything you are liking specially, please let us know!
Want to give it a try? Request access to Tinybird Analytics.