Time series data is everywhere, from weather forecasts to stock prices, shopping transactions, or usage logs. In fact, events data basically always carry a timestamp. And when you’re developing new data products or maintaining existing ones on top of time series data, you find yourself wanting a way to explore it, understand its patterns, and investigate problems.
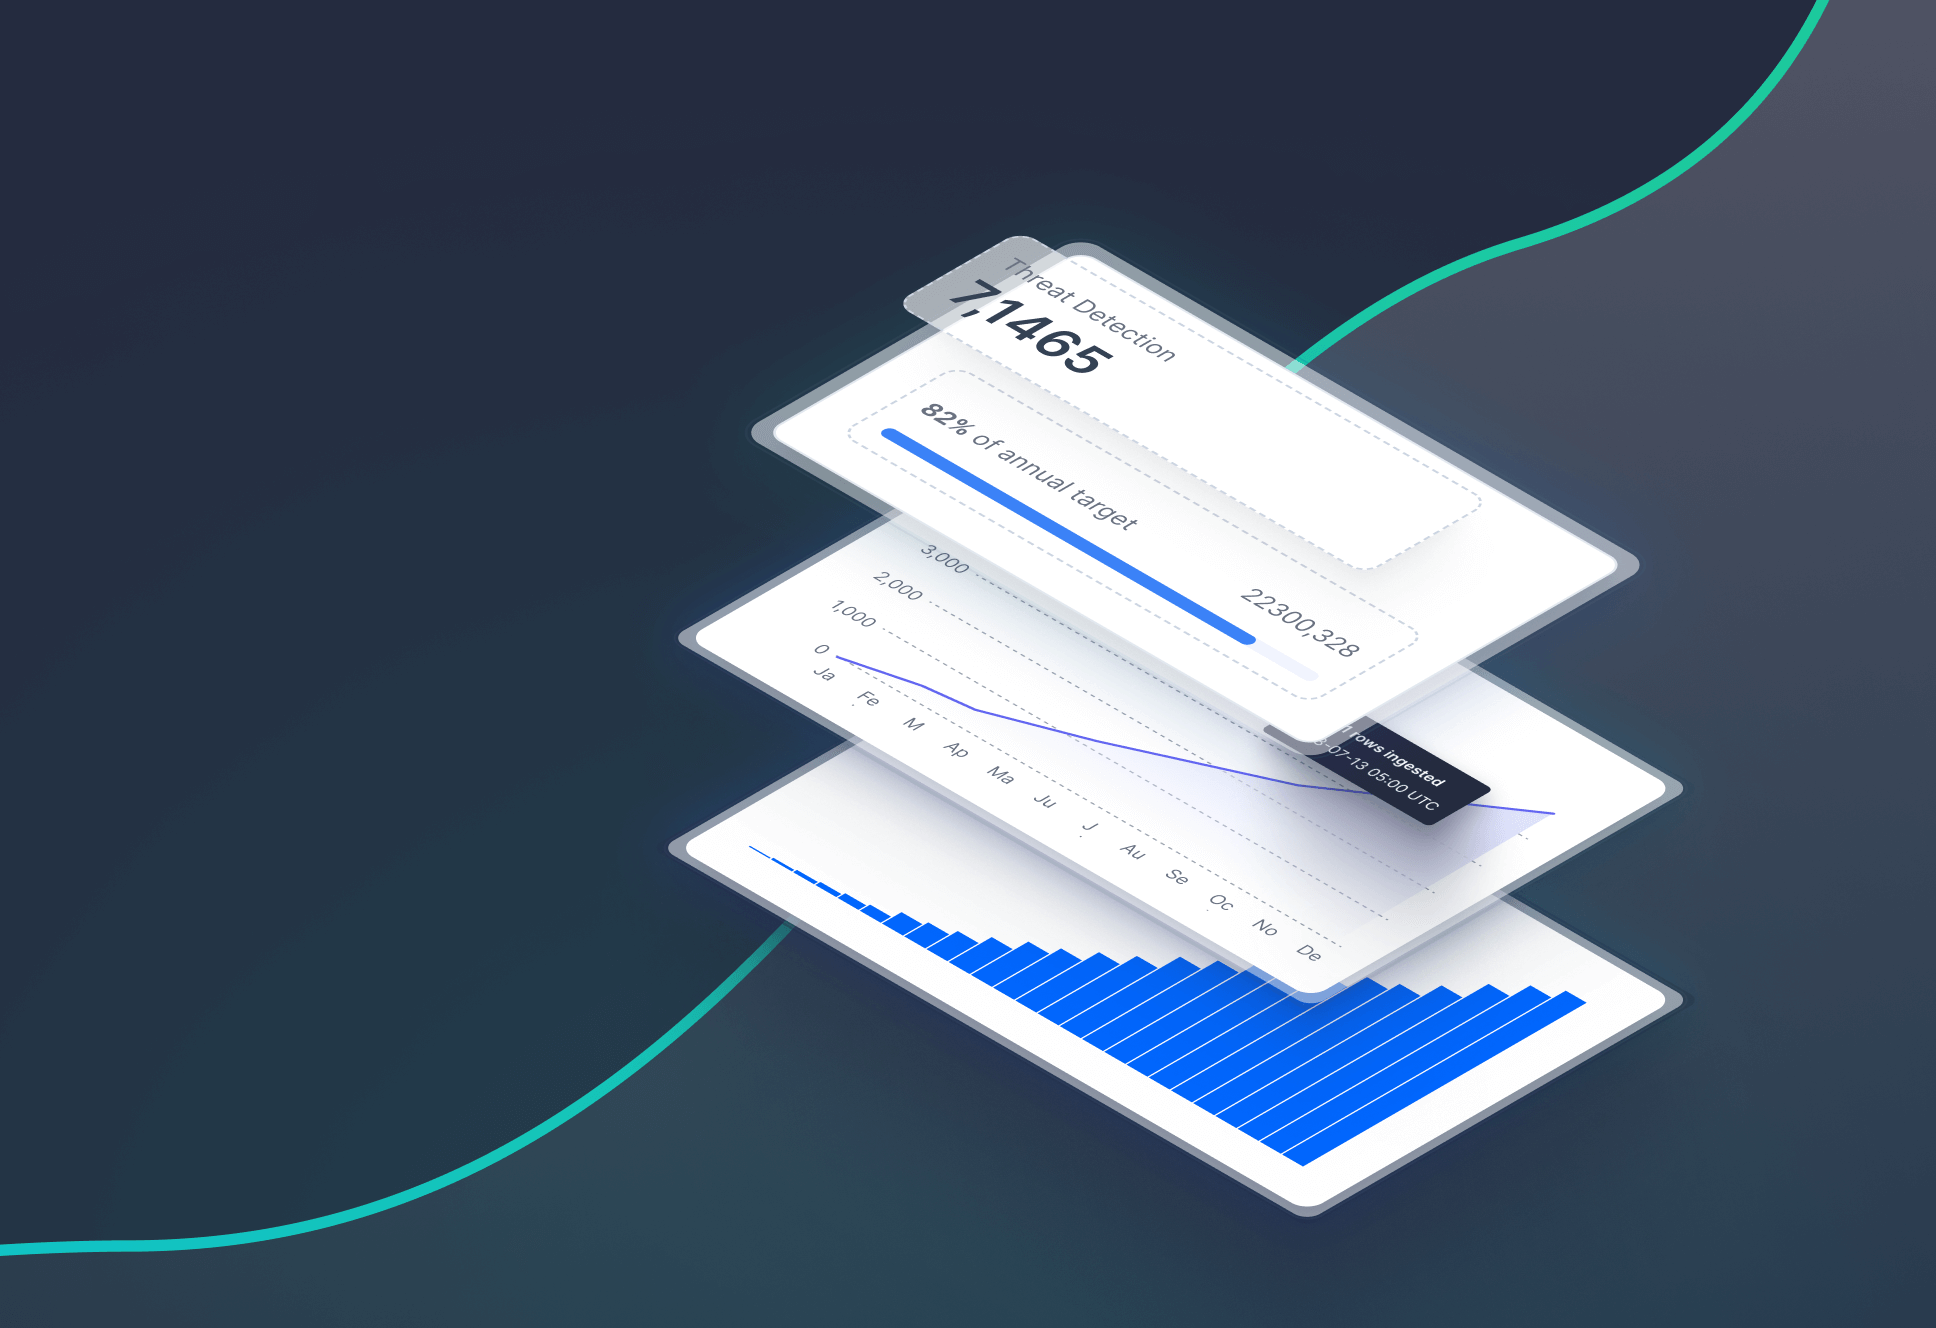
Visual interfaces - like a simple line or bar chart - give you the power to understand the shape of a time series curve and how variables are influenced by time. Does my web traffic change at different times or dates? When does my infrastructure usage surge? Where do these anomalies in my IoT data originate? What is the average P99 latency of my endpoints requests throughout the day? All of these questions have answers that can be discovered through visual time series exploration.
Introducing the Time Series UI
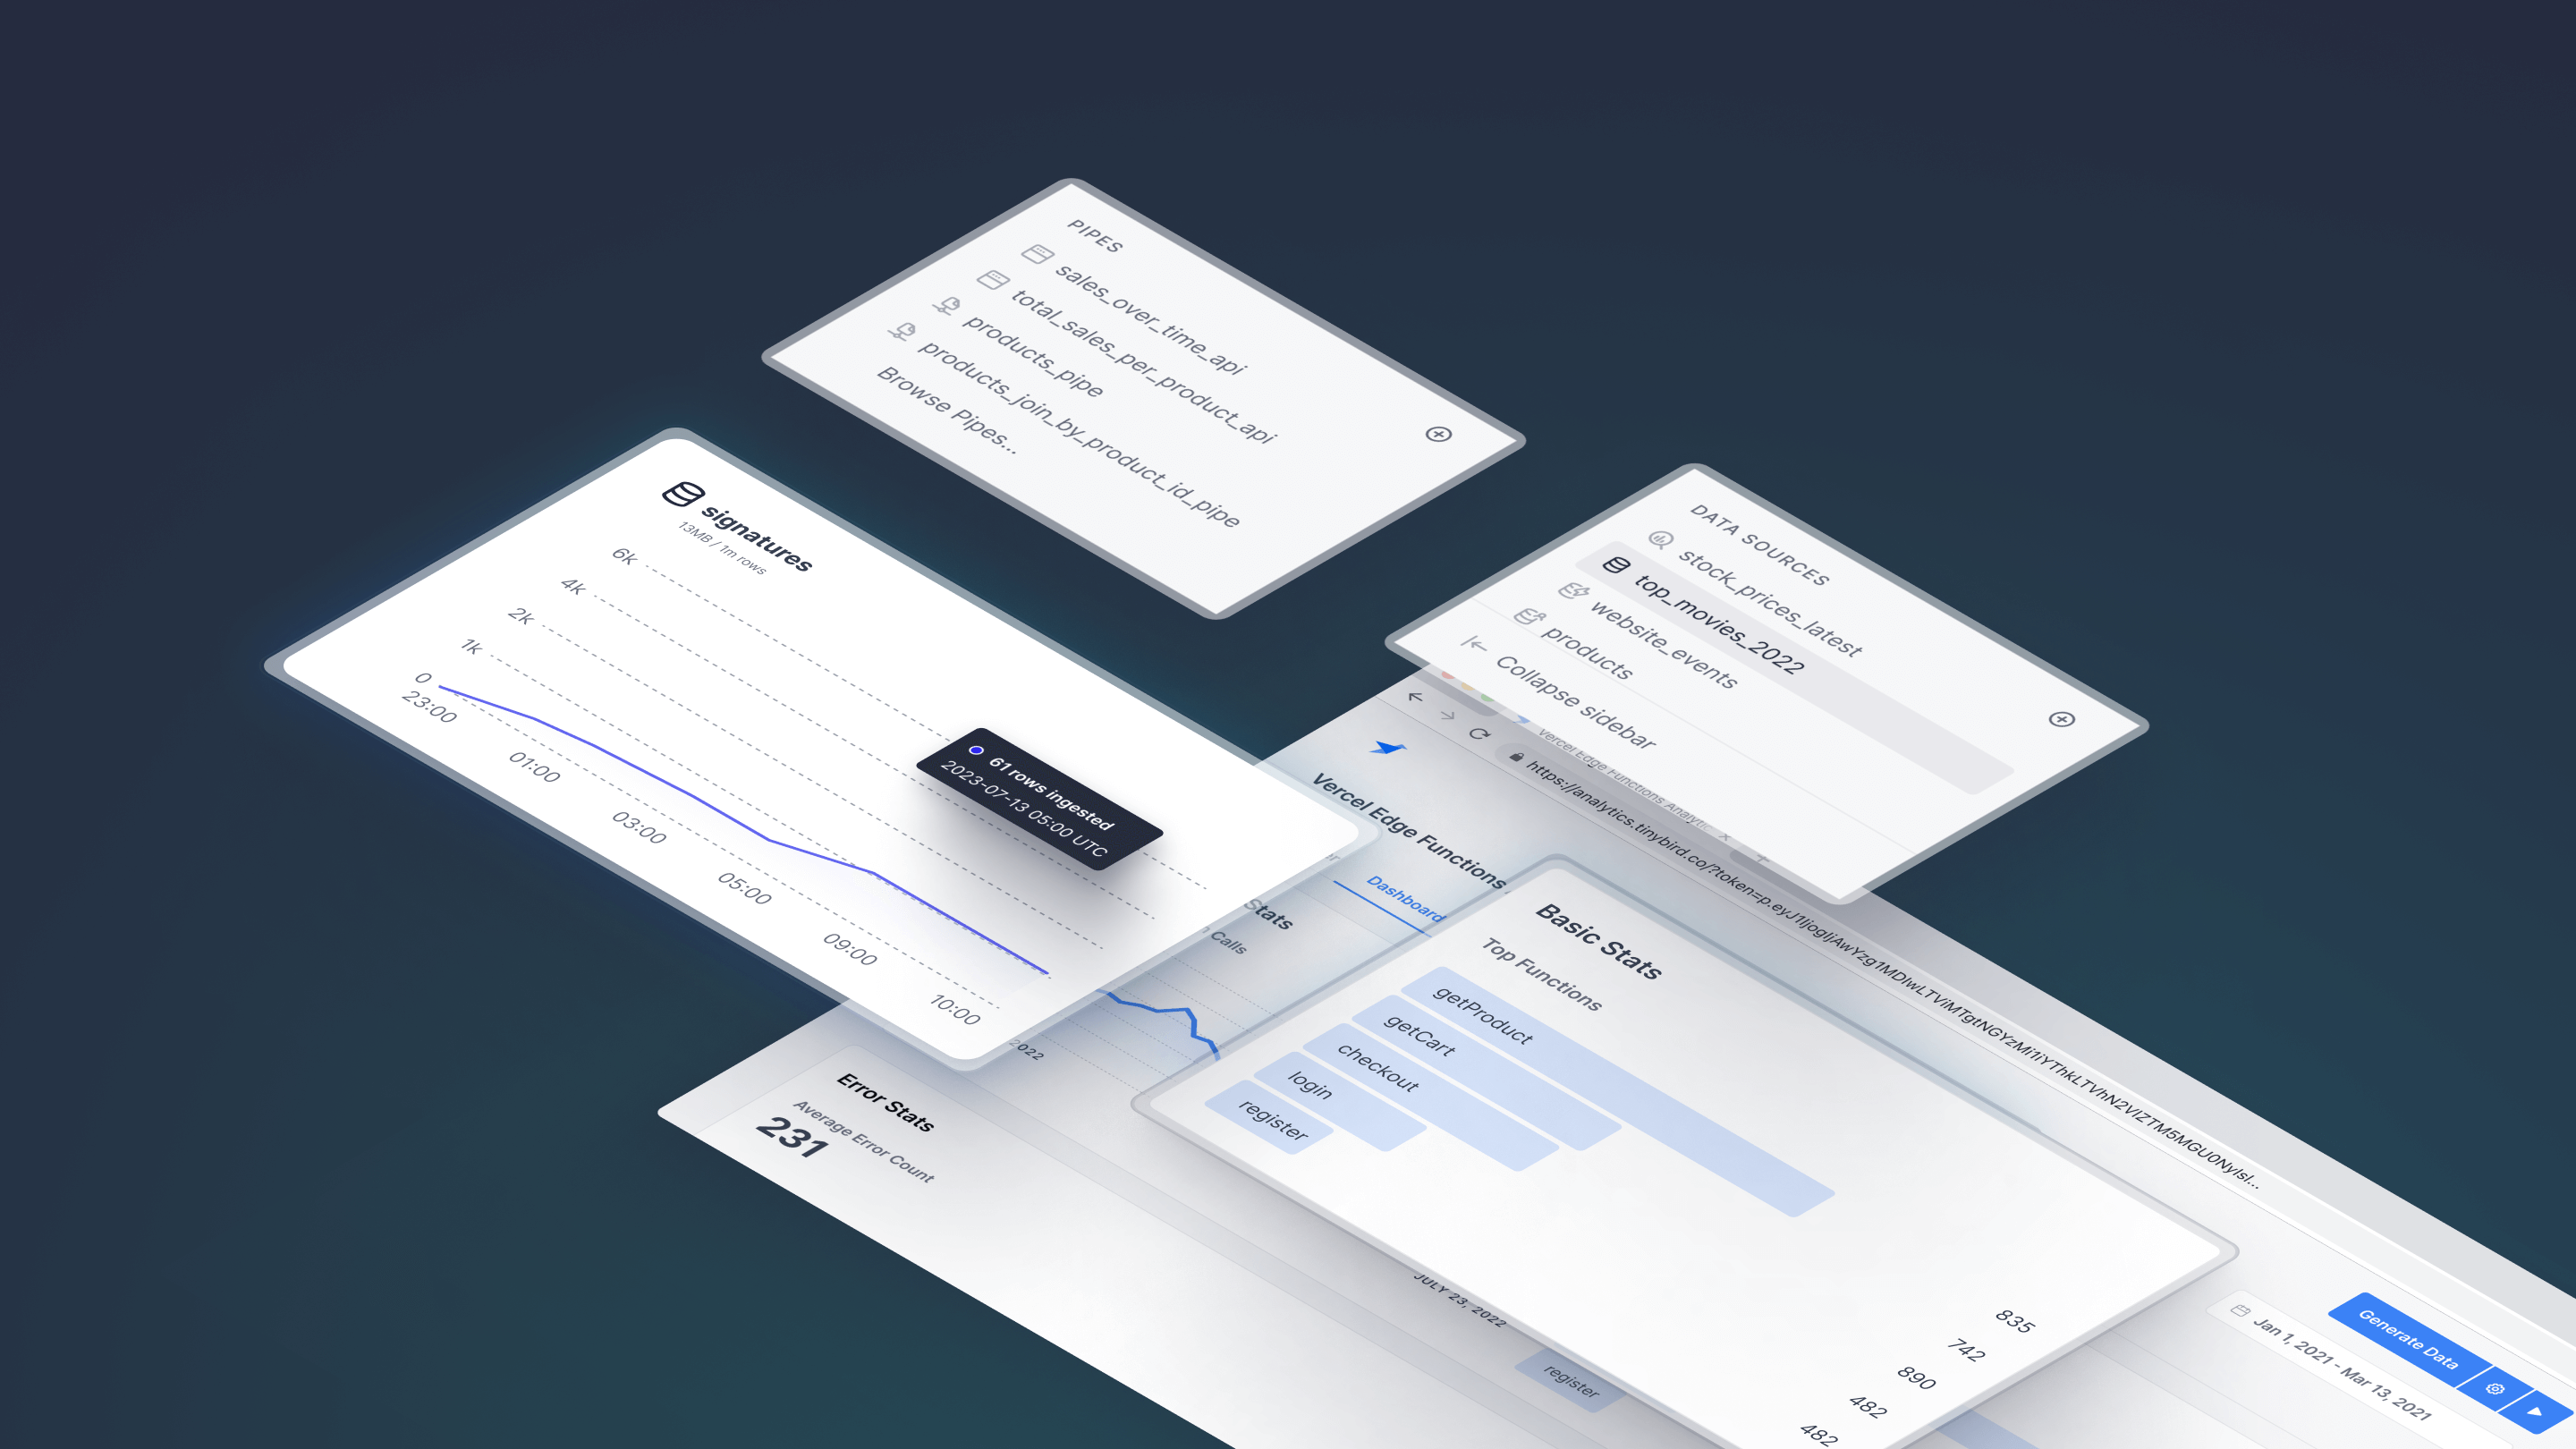
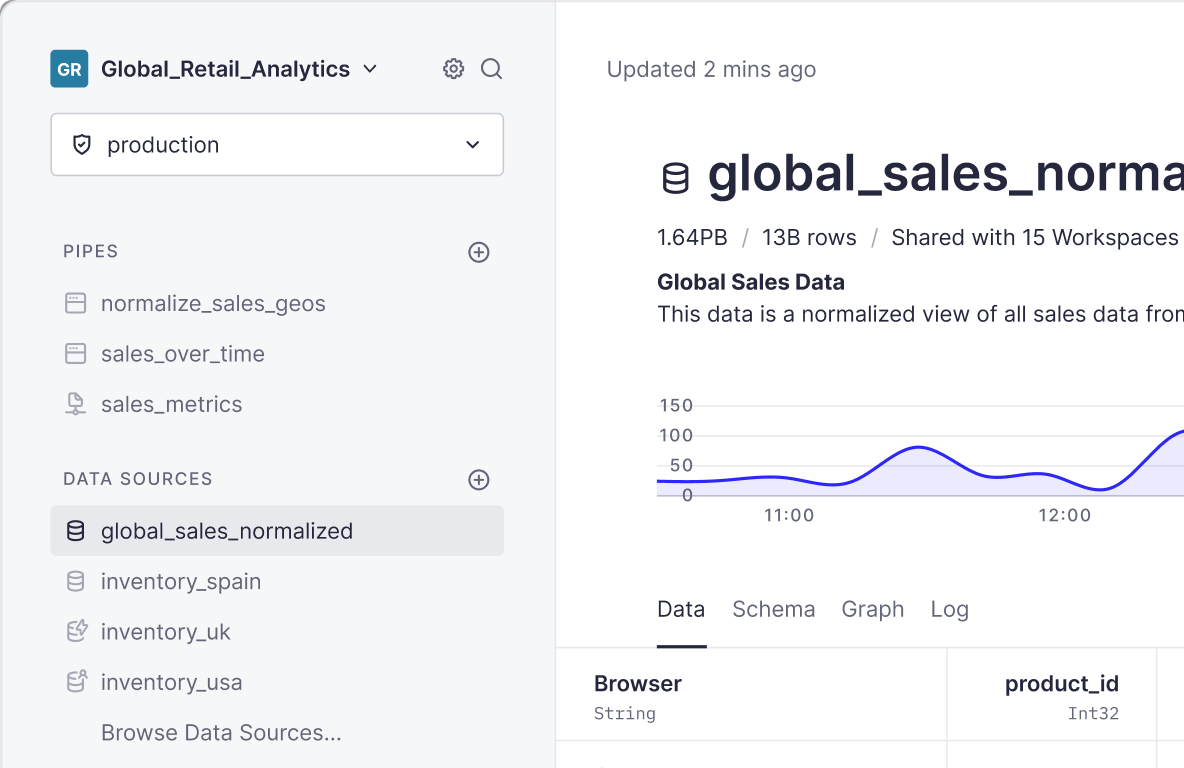
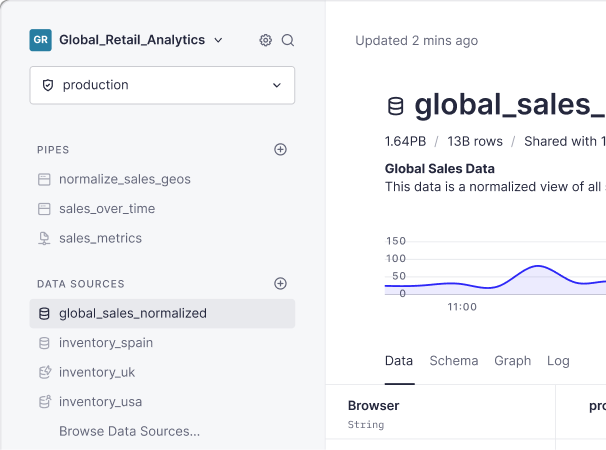
We want to help Tinybird users get more out of their time series data, and so we’re thrilled to introduce the Time Series UI in Tinybird. Time Series lets you visually explore and analyze data sources with a date/time column, filter and group them by selected columns, or simply monitor changes every second, so you can better understand what’s going on in real time.
The beauty of the Time Series UI is that it leverages the power of SQL - and all of the filtering, grouping, and aggregating that comes with it - while giving you a visual, even beautiful, representation of the result.
And it updates in real time, as soon as new data hits your Tinybird data sources.
What you can create with the Time Series UI
With the power of SQL and the beauty of time series charts at your fingertips, you can explore and analyze time series data in nearly countless ways. Here are a few ideas to help you get started.
Identify which of your endpoints consume more data
Data Source: tinybird.pipe_stats_rt
Visualize: sum(read_bytes)
Group by: pipe_name
Find errors in your APIs
Data Source: tinybird.pipe_stats_rt
Visualize: count()
Where: status_code >= 400
Group by: pipe_name
Monitor average ingestion duration
Data Source: tinybird.datasources_ops_log
Visualize: avg(elapsed_time)
Group by: datasource_name
See which blog articles people are reading right now
Data Source: analytics_events
Visualize: count()
Where: JSONExtractString(payload,'href') like ‘%blog%
Group By: path(JSONExtractString(payload,'href'))
Time Series is available for all Tinybird users
When you create a new Time Series in your Tinybird workspace, the rest of your team will automatically gain access to it.
You can also generate a public URL to share the visualization outside your team. Those with access to the public URL can explore the chart but won’t be able to change the original data source, filters, or groupings.
Time Series is now available for all Tinybird users. We hope it helps you in your journey building real-time applications on top of time series data. Give it a try, and if you like it, share your experience wherever you scroll (We see you, lobste.rs). If you think it could be better, we’d love to hear about it in Slack.