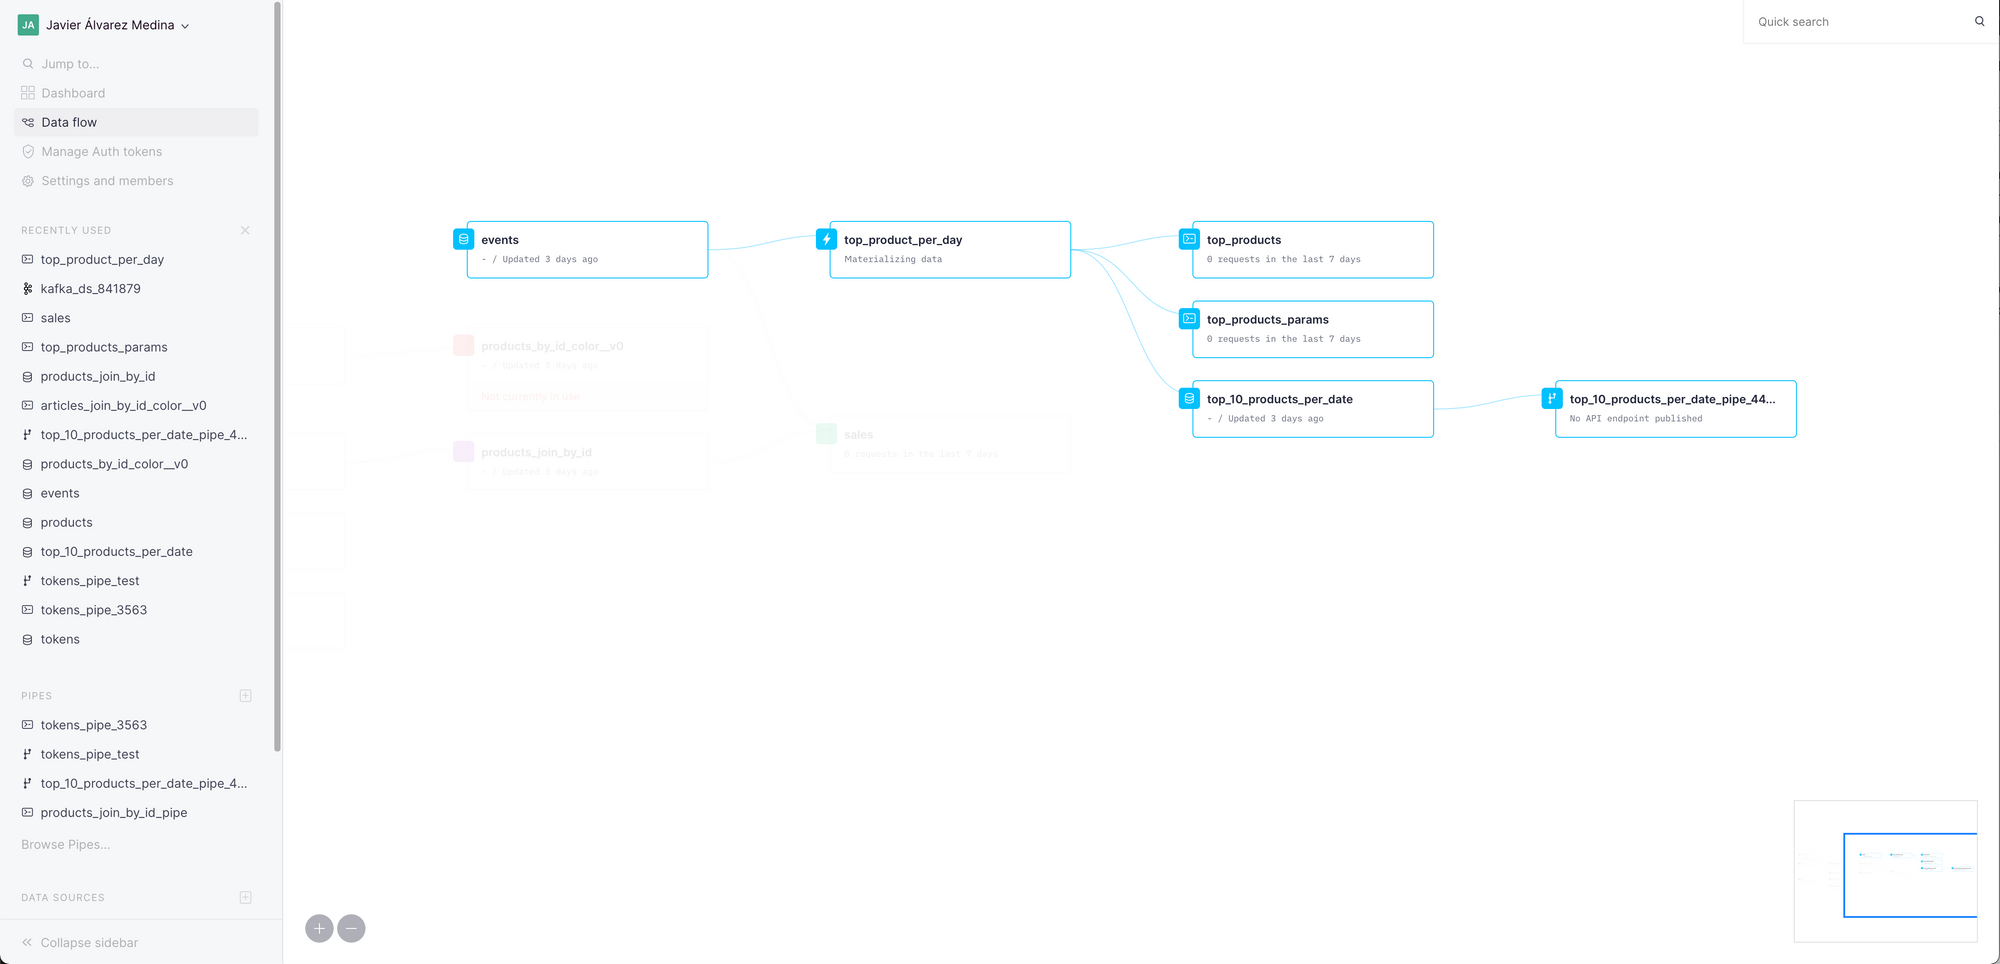
Improved Data Flow graph
Before, it was only possible to see one level of dependencies. Now, the Data Flow graph includes all the levels of dependencies, so that you can see better how all your Pipes, Data Sources and Materialized Views are connected.
Documented some previously hidden functions
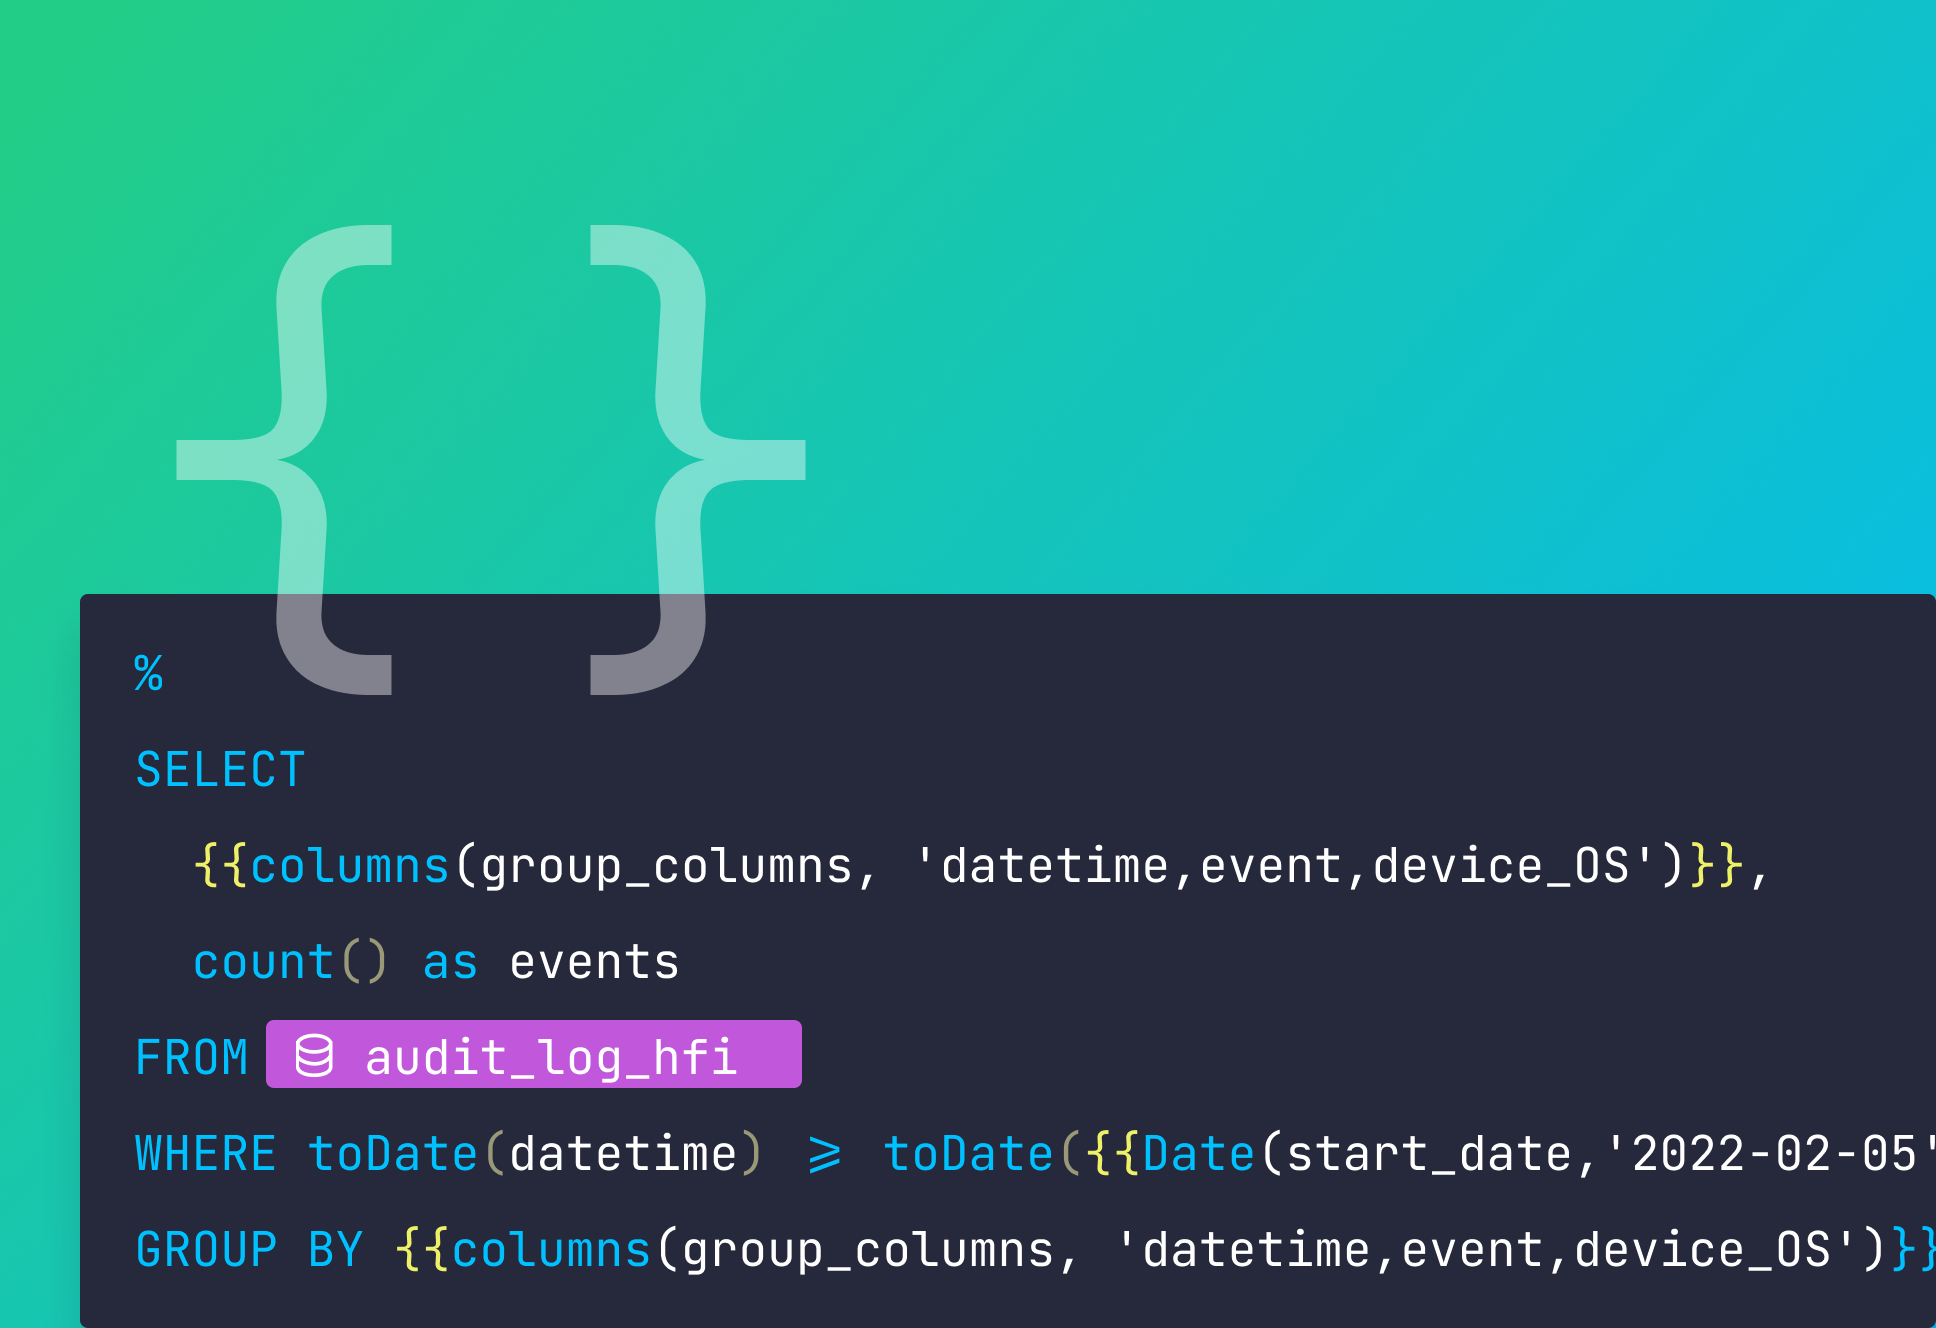
The {% code-line %}sql_and{% code-line %} function lets you construct SQL expressions concatenated with the AND operator, to filter results by the presence or absence of the value of a column in an array, passed by a dynamic parameter. It was present in the product before and we had been using it internally, and now everyone can benefit from it as well. For more practical examples on how to use all the template functions, check out this guide.
Choosing a column delimiter on the UI
Now, you can specify a delimiter when you create a Data Source via UI.
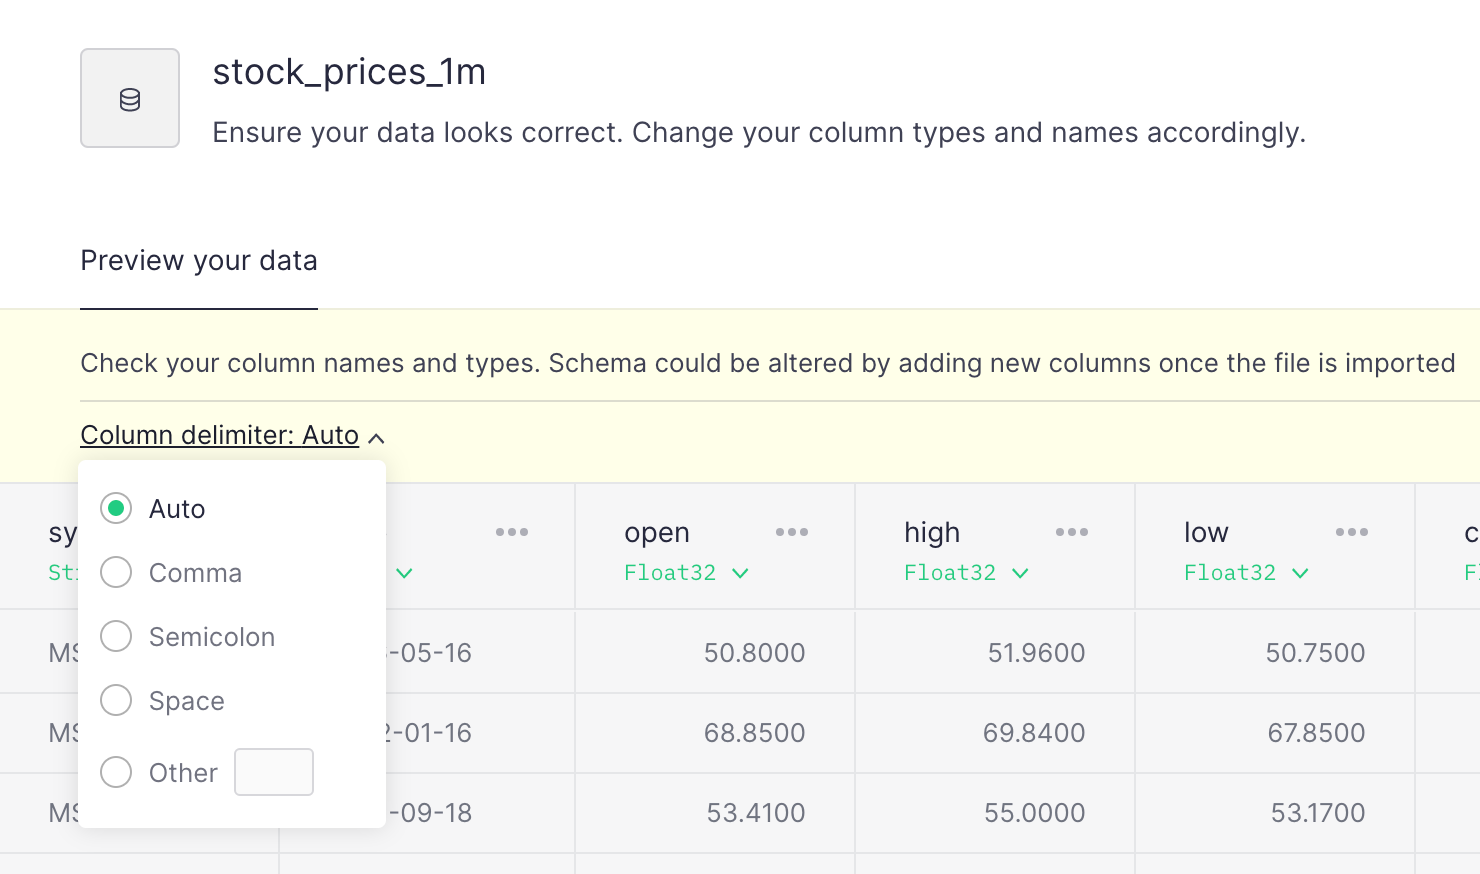
Remember that you can do it with the Data Source API, with the {% code-line %}dialect_delimiter{% code-line %} parameter.
CLI improvements
When you push a Data Source with incorrect syntax, our CLI will tell you which parts are wrong. So if you pass a bad data or engine type, you’ll be warned.
Here’s an example:
Kafka improvements
We’ve also been working hard to improve the Kafka connector that some of you are already using, both on the frontend (with a new real-time graph to visualize how data is being ingested) as well as on the backend.
Here you can see how easy it is to ingest data via Kafka to Tinybird:
While the Kafka connector is not open yet to all customers, we’ve opened access to it to all that have requested it. If you have a use-case where you’d like to ingest data via Kafka, please let us know and we’ll get back to you as soon as possible!
If you’re curious about it, you can also read some of Javi Santana’s reflections on Kafka in his blogpost here.
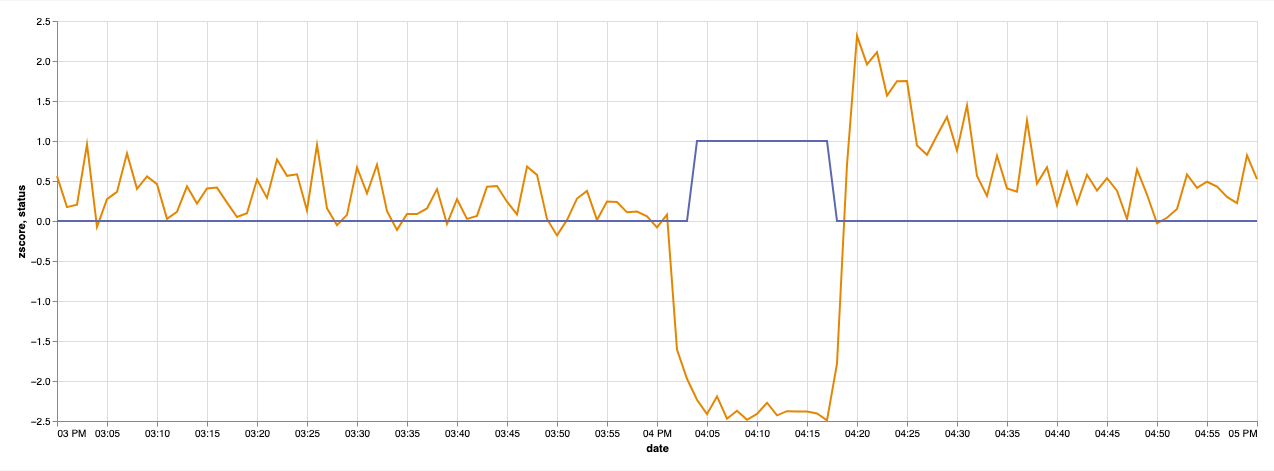
Anomaly Detection
It’s possible to do real-time anomaly detection using Tinybird, as Alberto Romeu explains in his latest post. Read the full post here!
Ingesting JSON data
We’ve also written this guide where you can learn how you can also ingest JSON data to Tinybird as a 1-column CSV file, and extract the values you want with Materialized Views.
For a real-world example of that, we’ve also recorded a video on how you’d create multiple Materialized Views to have real-time leaderboards for a video-game platform:
One more thing…
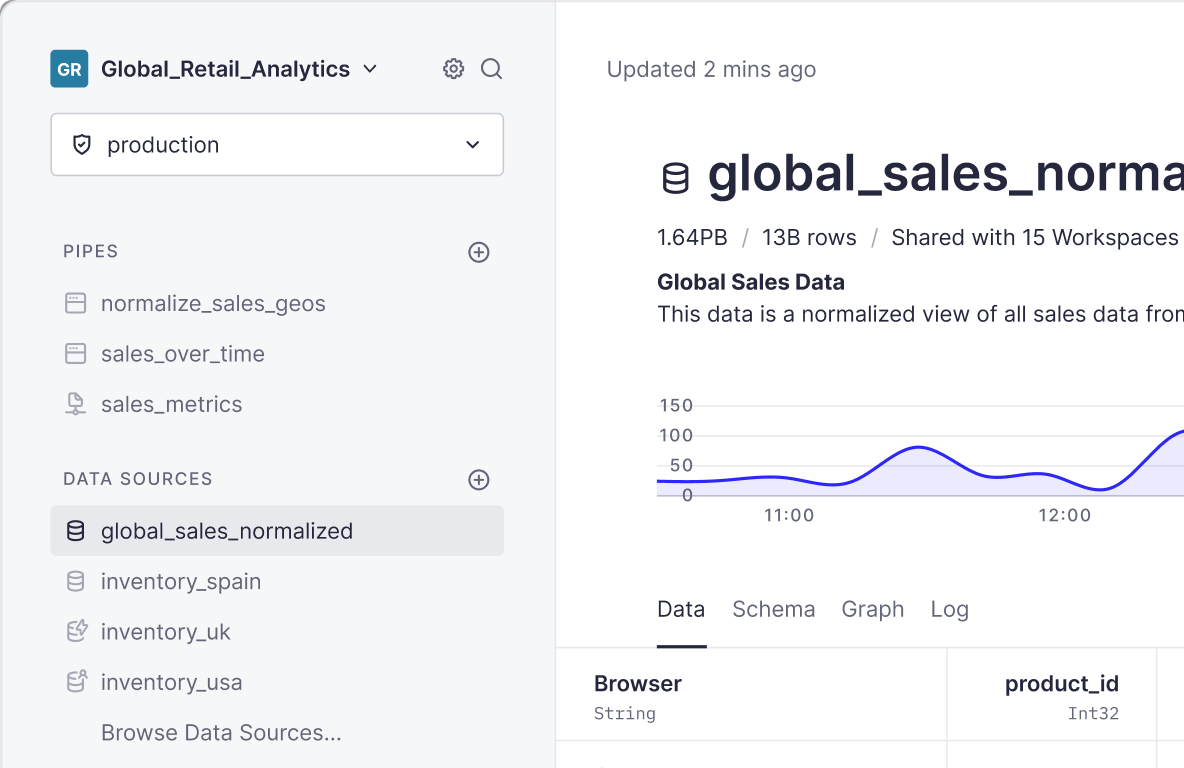
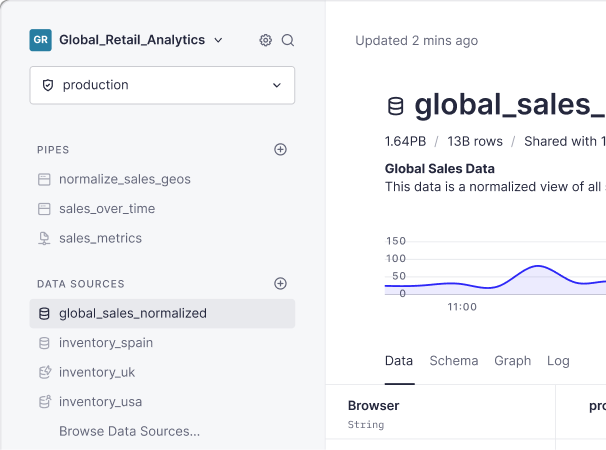
We’re also working on a feature that will let you share read-only Data Sources across workspaces. More info on this soon!